|
|
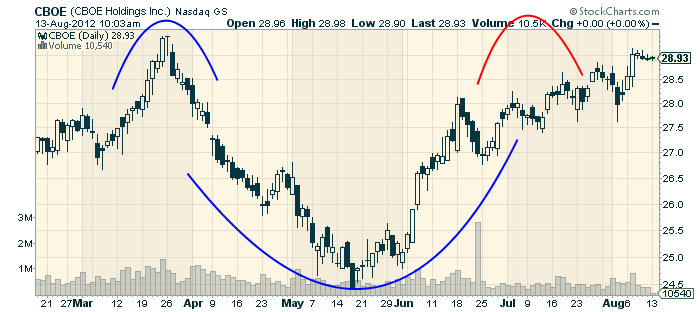
Check out the cute curves on this "little number":
Those three lines were created with our new Parabola tool that we added to the Flash version of our ChartNotes annotation tool last weekend.
(The red curve was added for fun - just to complete the "smiling face" look on the chart!)
A parabola is a curve created from three points - one at each end of the line and one at the top/bottom of the curve. By moving the three points around, you can stretch a parabola into any curve that you want.
To create a parabola using ChartNotes, click and hold down your mouse over the "Line" tool button near the top left corner of the ChartNotes window. When you do that, two additional line drawing tool buttons will appear, one for our "Speed Lines" tool, and below that, the one for our Parabola tool.
After clicking the Parabola tool button, you can draw a parabola in one of two ways. You can either click and release your mouse at each of the three points that make up the curve OR you can do it the "fun" way - you can click and drag your mouse to create an "approximate" parabola that we will then replace with a real parabola as soon as you release your mouse button.
Parabolas are prefect for annotating things like rounding bottoms and cup-with-handle patterns but I bet there are lots of other great uses for them that you will find over time. Enjoy!
- Chip


Posted by: Tim Farrar August 14, 2012 at 07:38 AM