|
|
The new User-Defined Index (UDI) feature that we introduced with our PRO service last week is extremely flexible and powerful. In the last edition of our ChartWatchers newsletter, I showed how it can be used to chart economic datasets downloaded from the Internet. Today I'm going to show you how you can use a UDI to plot any technical indicator you can imagine.
OK. Let me say up-front that this is not for the meek or the timid. You need a spreadsheet program like Excel and you need to know how to use it. Unfortunately, I'm not going to be able to explain every detail of using Excel in this article; however, if you have some Excel experience under your belt, you should be able to follow along.
What I want to show you today is how you can use the download and upload features of our PRO service, combined with Excel, to calculate a special kind of moving average called "DEMA" - the Double Exponential Moving Average.
First off, the formula for DEMA is as follows:
DEMA(20) = (2 * EMA(20,close)) - (EMA(20, EMA(20,close)))
(In theory, DEMA is a "better" moving average than a regular EMA. Whether that is true or not is beyond the scope of this article. As we will see, DEMA does tend to remain closer to the price bars.)
Step One - Download the price data for the ticker symbol we are interested in
PRO users can download our daily price data by clicking on the "Past Data" link underneath any SharpChart of the symbol they are interested in. The "Past Data" page has a "Download" link that PRO users can use to save the data on their hard disk.
Step Two - Open the downloaded price data in Excel
The downloaded data is in CSV format. You should be able to simply double-click the file to open it in Excel.
Step Three - Calculate the EMA(20,close) column
Our ChartSchool article on Moving Averages has an example of how to do this. Basically, use the Average() function for the first 20 rows of data in the "Close" column, then, in the 21st row, add the EMA formula:
(Today's Close - EMA(previous day)) * multiplier + EMA(previous day)
where multiplier = 2 / (period + 1) = 2 / 21 = 0.095238
Step Four - Calculate the EMA of the EMA column
This gets a little strange but essentially you need to do the same thing as before, but instead of averaging data from the "Close" column, you use the data in the column from Step Three. Check out the spreadsheet that I've attached to the bottom of this article if you get confused.
Step Five - Calculate the DEMA column
Now that we have columns for EMA(20) and EMA(20,EMA(20)), we can calculate the DEMA column. Remember, DEMA(20) = (2 * EMA(20)) - EMA(20,EMA(20)) i.e., 2 times the first column we added minus the second column we added.
Step Six - Copy the Results into a New Spreadsheet AS VALUES!
Now we need to create the CSV file that we will upload into the @MYINDEX area of our account. We start by using Excel's "File/New" command to create a new, empty spreadsheet. Next we copy over all of the dates from the "Date" column in our calculation spreadsheet. Then we select all of the "DEMA" column that we calculated and copy it onto the clipboard. Finally, we use "Edit/Paste Special" to paste it into the second column of our new spreadsheet. When "Paste Special" asks us which format we'd like to use, be sure to select "Values" so we are pasting in just the results of the calculation, not the formulas.
Step Seven - Save the Results as a CSV File
Use Excel's "File/Save As..." command to save the new spreadsheet to your hard disk. Be sure to set the "Format" dropdown to "Comma Seperated Variables" before hitting the "Save" button.
Step Eight - Upload the DEMA Data into Your @MYINDEX Area
Go to the "User Defined Index Workbench" area of your PRO account and click "Delete All Data" (to clear out any previous data you uploaded) and then click the "Upload Spreadsheet Data" link to start the upload process. Click "Choose File" then select your saved CSV file and press "Upload" to start the process.
Note: Right now, uploading a full data file takes about 4 minutes. We hope to reduce that time in the near future. For now, you need to be patient while the data uploads.
Step Nine - Chart @MYINDEX on top of your original stock using the "Price (same scale)" Overlay
Create a new chart for your original stock, then add the "Price (same scale)" overlay to that chart and enter "@MYINDEX" as the parameter for that overlay.
And we're done. PHEW!
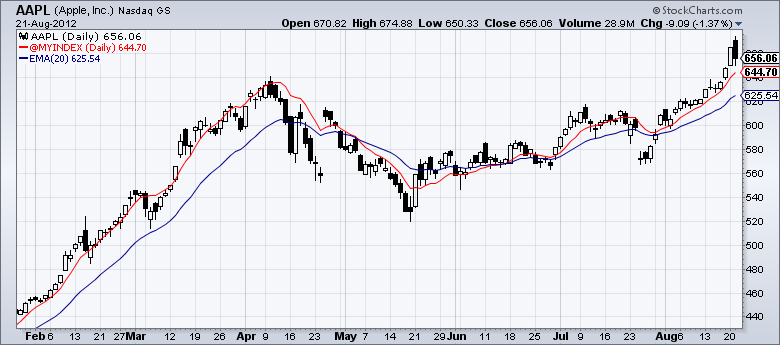
If you did everything correctly, you should see something like this:
On this chart of AAPL, DEMA is the red line. I've also included a regular 20-period EMA as the blue line for comparison purposes. (See how the DEMA line is "faster" than the EMA line?)
So this is a chart of an indicator that WE DO NOT SUPPORT (yet). That to me is amazing!
So now you are thinking "That's A LOT of steps!" and you are correct. Over time, the process will become easier but in order to have the full power of Excel in your charts, you need to do what it takes to get the data into and out of it like I showed.
TEMA anyone?
- Chip
Click here to download the sample DEMA Excel Spreadsheet (1MB) used in this article.


Posted by: Bruce M Mills September 05, 2012 at 10:42 AM