|
|
I've written a couple of articles already about our new User-Defined Index (UDI) feature that PRO users currently have (and that we hope to expand to Extra users soon). The ability to upload time series data and then chart it with our tools is very powerful but here's one of the simplest things you can do with it - you can correct "mistakes" in our data.
We work very hard at providing accurate data for our charts and, from our perspective, our data is as accurate as it can be. It is verified and validated against multiple sources before it is posted. If someone reports a problem with our data, the issue is thoroughly investigated and corrections made when appropriate.
Now, all that being said, sometimes people disagree with our data for one reason or another. A great example of this situation is when an unusal volume spike appears seemingly out of the blue. Often, unexpected volume spikes are caused by mis-keyed trades or other human errors that for whatever reason are not corrected by the exchanges. That puts us - StockCharts - in a bind. We are committed to providing data based on what the exchanges say, regardless of if it "makes sense" or not.
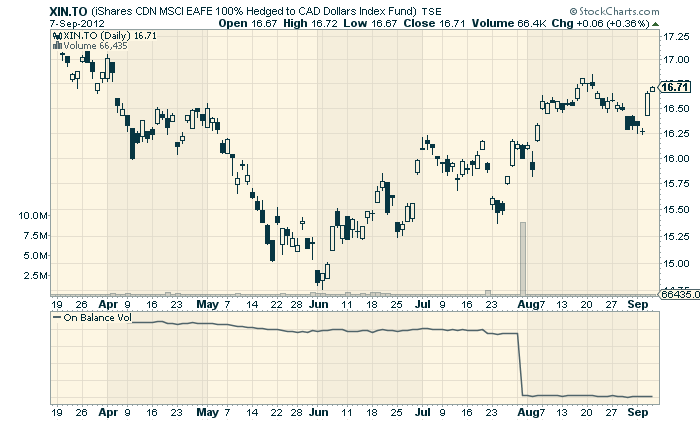
Consider the following chart:
(Click here for a live version of this chart.)
That big volume spike on July 31st also exists in the data reported by Yahoo Finance and BigCharts.com. Given that this is an ETF, there may have been some legitimate end-of-month rebalancing that resulting in that tall bar. That said, it sure looks suspicious doesn't it? There was no huge price movement associated with it and both prices and volume continued the next day as if nothing special had happened.
That spike "messed up" our chart's volume display making it much harder to interpret the other volume bars. It also caused the OBV indicator to drop tremendously (as well as any other volume-based indicator we might want to use). It would sure help our chart analysis if that spike was removed...
Now, by using User-Defined Indexes, we can remove it ourselves! Here are the steps:
Step One - Download the price data for the ticker symbol we are interested in
PRO users can download our daily price data by clicking on the "Past Data" link underneath the XIN.TO SharpChart. The "Past Data" page has a "Download" link that PRO users can use to save the data on their hard disk.
Step Two - Open the downloaded price data in Excel
The downloaded data is in CSV format. You should be able to simply double-click the file to open it in Excel.
Step Three - Find and fix the data point
Let's change the volume value for July 31st, 2012 to 91332 which is the current value divided by 100 and seems to better match the adjacent volume bars.
Step Four - Save the data as a CSV File
Use Excel's "File/Save As..." command to save the new spreadsheet to your hard disk. Be sure to set the "Format" dropdown to "Comma Seperated Variables" before hitting the "Save" button.
Step Five - Upload the CSV file into Your @MYINDEX Area
Go to the "User Defined Index Workbench" area of your PRO account and click "Delete All Data" (to clear out any previous data you uploaded) and then click the "Upload Spreadsheet Data" link to start the upload process. Click "Choose File" then select your saved CSV file and press "Upload" to start the process.
Step Six - Chart @MYINDEX
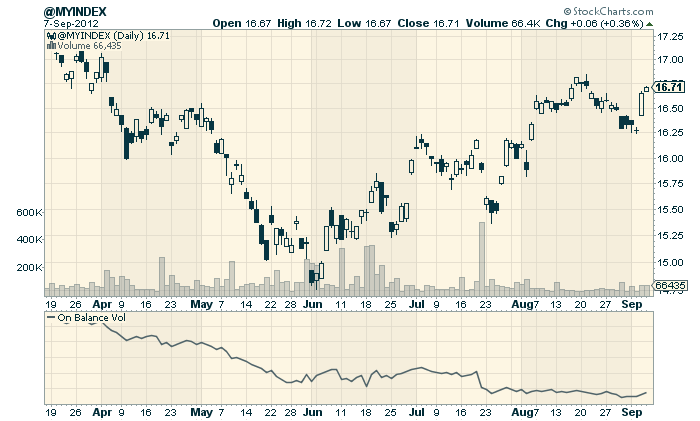
If everything went correctly, you should see something like this:
That looks much better in the sense that our volume bars are not squashed and our OBV indicator doesn't have that huge drop on it any more.
Of course, your interpretation of a chart that's based on modified data must be tempered by the knowledge that you are looking at unofficial, altered data. Caveat emptor!
Again, User-Defined Indexes (UDIs) are extremely flexible and powerful. Next time, I'll show you how you can create your own Bullish Percent Index with them.
- Chip


