Spring has sprung in North America. The planting season has been rolling north as the temperatures firm up. On the webinar, I spent a significant amount of time discussing the world of Agriculture and drilled down into the components of some of the major Ag ETF's.
"Commodities Countdown LIVE!" with Greg Schnell - 2016-05-12 17:00 from StockCharts.com on Vimeo.
Webinar Highlights // $CRB // $CRB Components 7:00 // GSCI Indexes 17:00 // Energy Related 27:00 // Gold/Silver 32:00 //Lumber 35:00 // Industrial Metals 35:00 // Agriculture 39:00 // AAPL - BBRY 55:00 //
Commodities are at a critical level. The chart break shown below could have massive global implications if it is unable to get back above the red line meaningfully. Let me define why this is so critical.
After breaking down through 45 years of support at $182, we are now 'back-testing' this level. A backtest is a crucial exercise in Technical Analysis. When price action breaks through a support layer like the $CRB did, it will create an oversold situation. On the bounce back up, the retest is critical to define the end of the bear market by breaking back above the previous support level and continuing to rise into a familiar trading territory. In the chart below, that would be the red line at $182. However, should the price action stall at the retest and fail to break back above, this would confirm a major change in trend. On a monthly chart of 45 years, this would be a revolutionary change that almost every active investor has never seen in their careers. It brings in the potential that we are in a long-term deflationary environment.
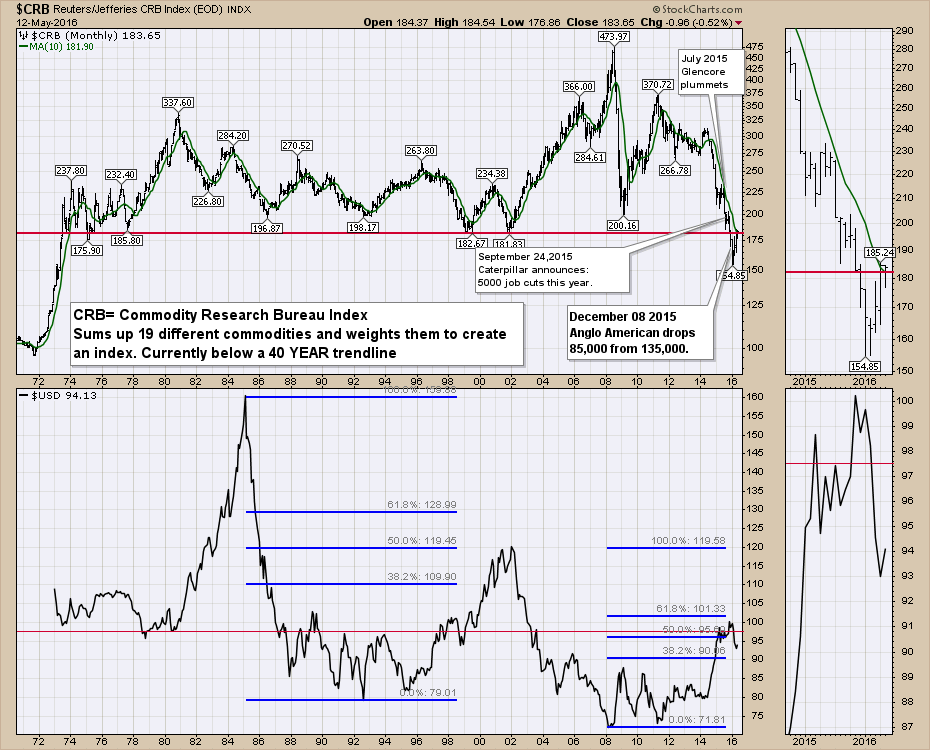 To discuss that serious breakdown a little more, Kondratieff, a Russian economist, discovered a commodity cycle of 34 years up (2/3) and 17 years (1/3) down. Let's consider this relevance to the current chart. 1972 to 2008 would be a 36-year cycle up. That looks clear on the chart. Perhaps we are in the middle of a 15-year cycle (51 years-36 years=15 years) down. If so, we are only 8 years in (2016-2008 = 8 years). It would not be uncommon to have a spirited multi-year rally in the middle of this massive decline. Let's leave it with the potential that we could be in the final third of the Kondratieff cycle. Let's also be open to the potential that the commodity cycle tops out this little rally here and creates long-term deflation. We could also be in the middle of the long-term down cycle (it feels like a down cycle) but we could see a multi-year run against this trend. So while we think we have seen it all, it might just be that human lifespans are relatively short, and we have not lived through an entire commodity cycle as Kondratieff described.
That is more than enough big picture discussion, but let's keep an open mind, and recognize the backtest discussed above is critical. This is not the time where the next trend is obvious.
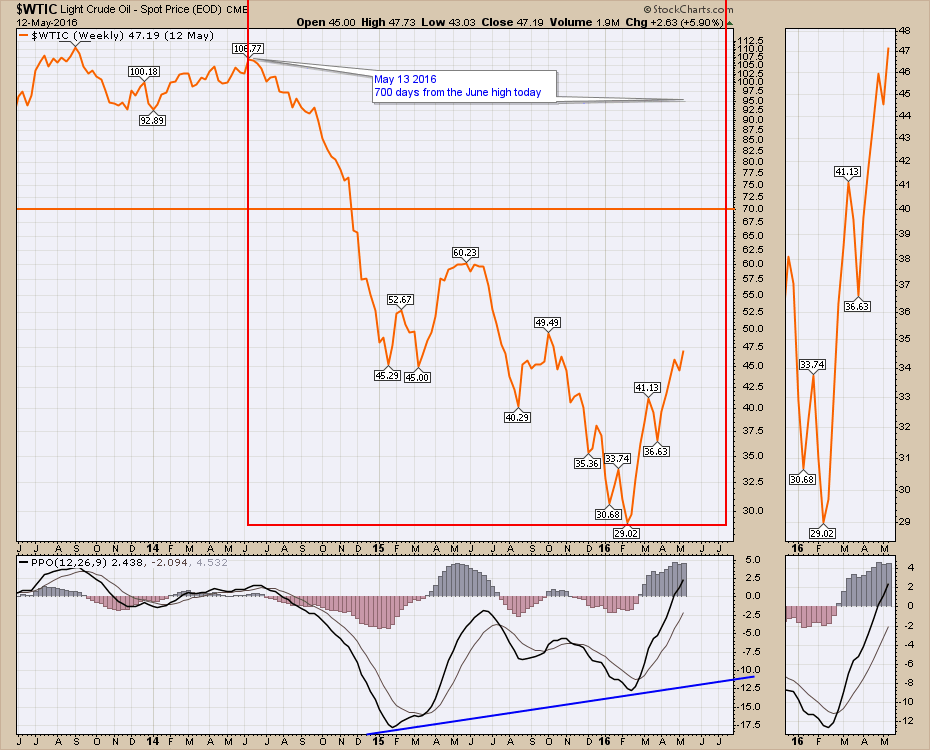
Reverting to oil, we are 700 days since the last high in June 2014 before we had the major break in the crude charts. Next month will be two years from the highs. Multiple bankruptcies were showing up this week for some oil producers.
 The SPDR ETF, XLE, is still in an uptrend channel. There is horizontal resistance around $70. We are above the 200 DMA, but there is negative divergence on the momentum which is demonstrated by the red line using the KST indicator.
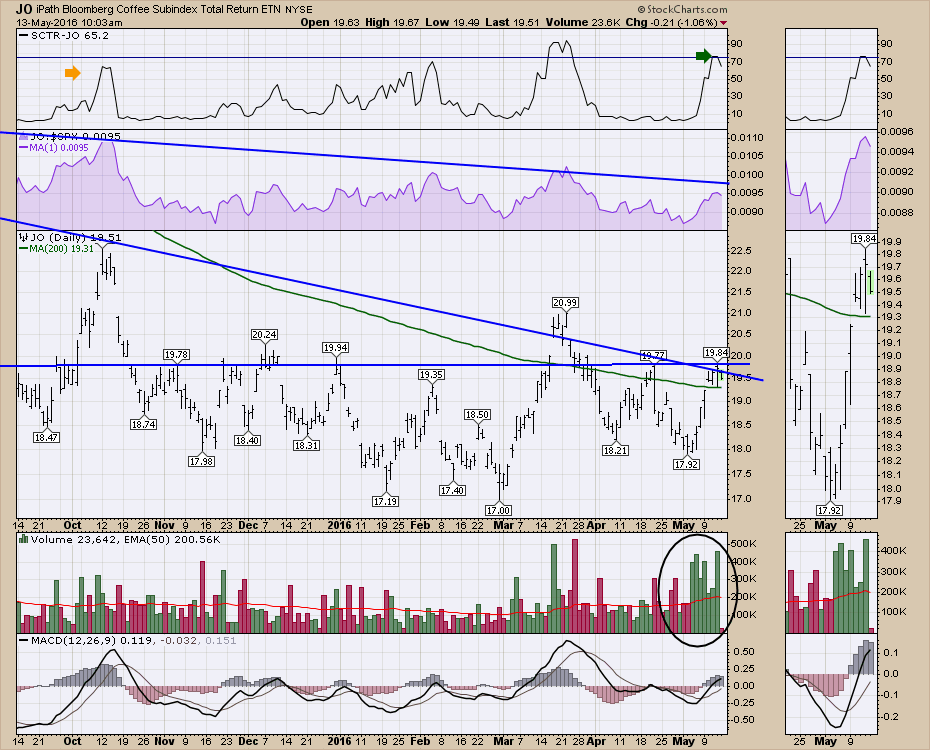
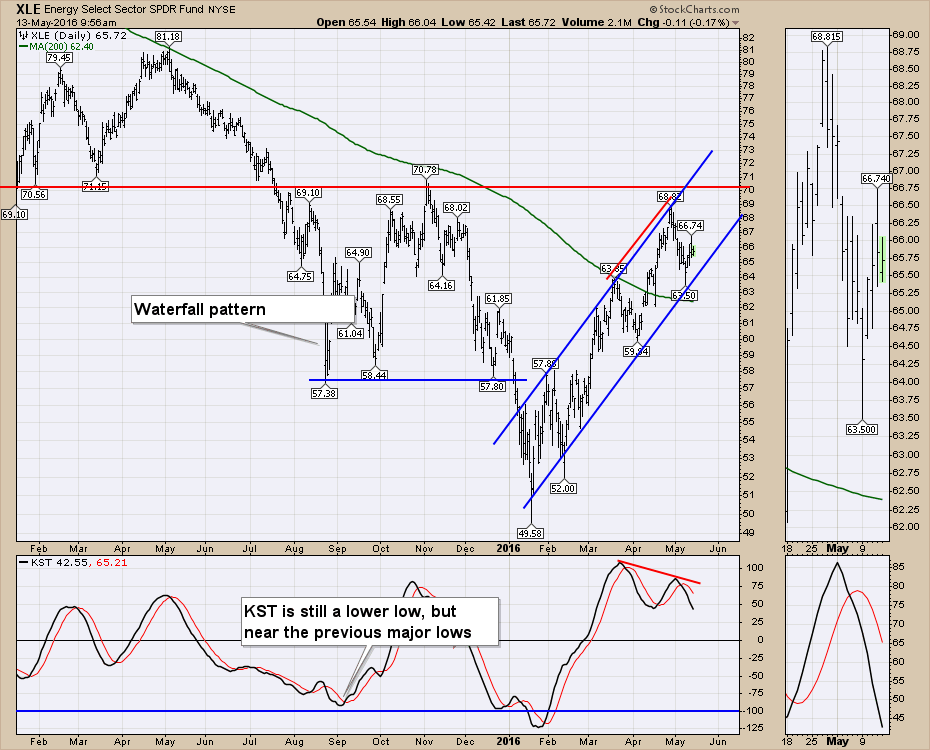 Moving on to the Agriculture related commodities, here is a chart of the coffee ETF, JO. Coffee futures are a component of the Agriculture ETF, DBA.
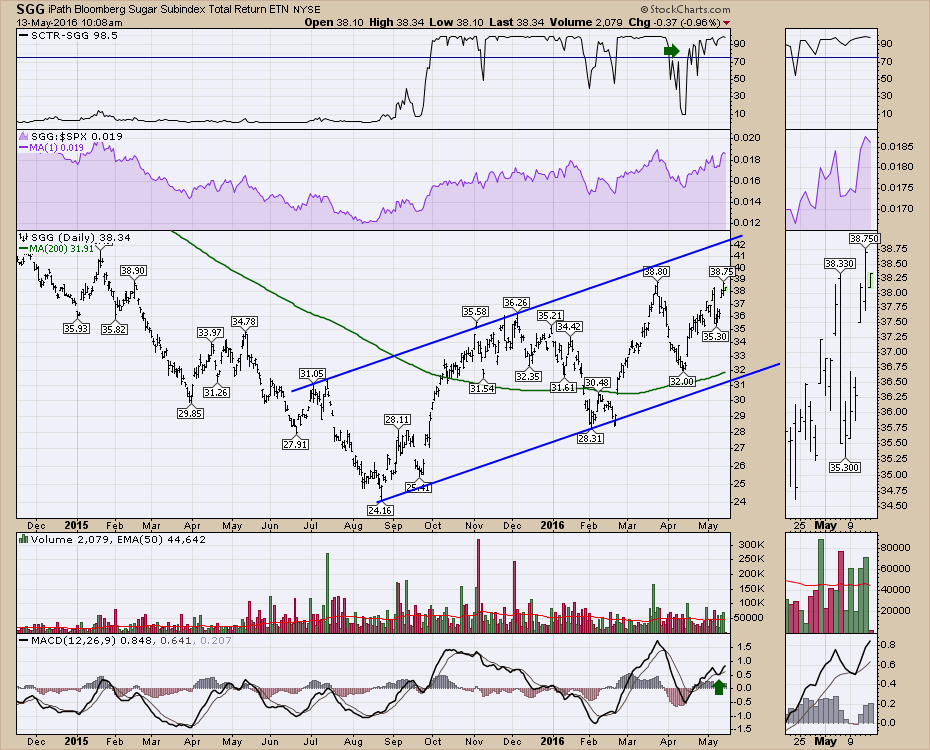
 Sugar has been performing very well.
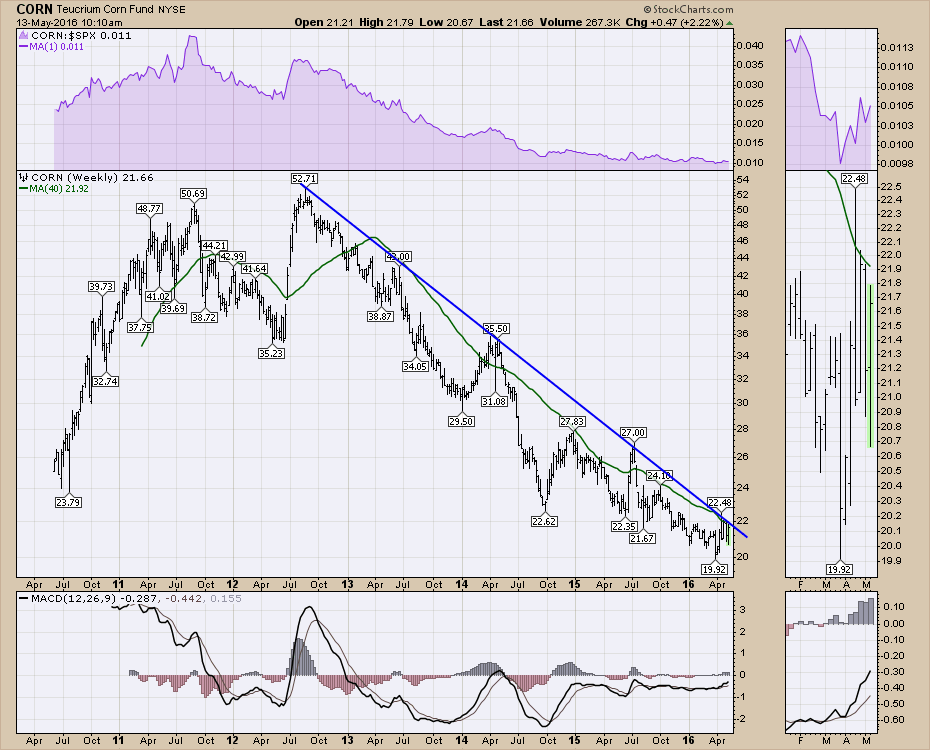
 Corn is still having trouble pushing up. Corn tends to lead in the agriculture arena, so this is worth watching to see if it can start to break out.
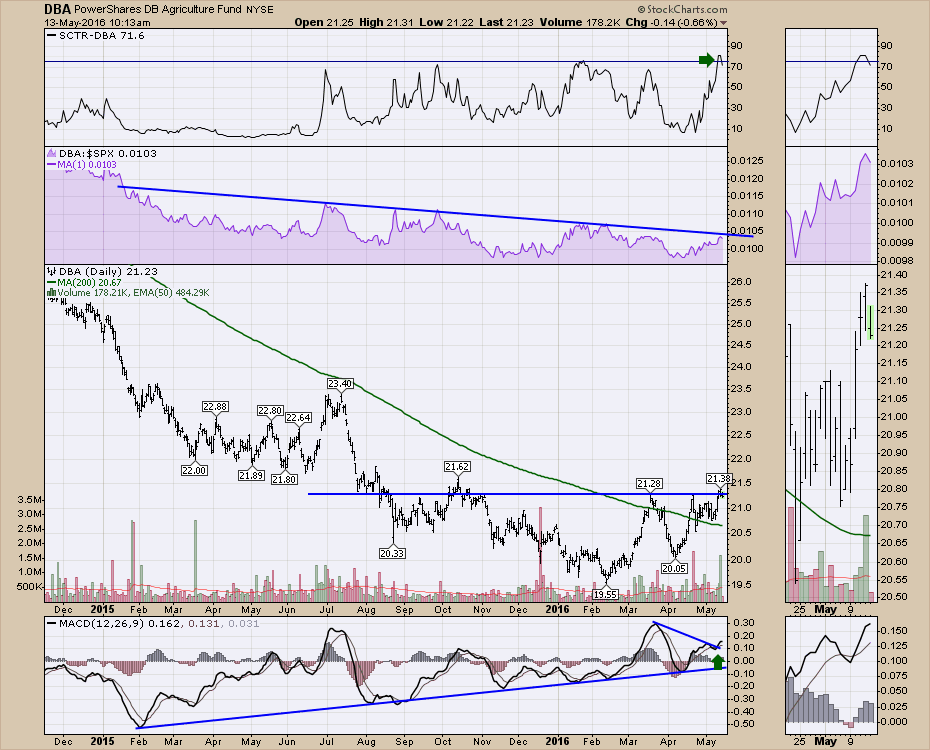
 DBA is an Agriculture ETF. We can see the importance of this resistance level. If it can't break through resistance, this is not an investment I want to hold.
 In conclusion, the Energy sector has rallied and $50 looks like a near-term potential target. If both Agriculture and Energy can get going, the odds of the deflationary environment will be muted. As long as these trends can hold this area or start to rise above, we have to be bullish. Should these products roll over, it puts the big macro picture on the table. That big macro picture is the failure of the $CRB to get back through 18.
If you would like to receive this blog content by email, click on the Yes button below. You can also access other articles by me on The Canadian Technician blog. Click Yes below those blog articles as each blog needs to be subscribed individually. Also, Martin Pring did a webinar this week and you can view it by following this link. Market Round Up Live 2016-05-13. Martin has some very interesting messages on the long term situation.
This week's Commodities Countdown Webinar 2016-05-12 rolls through many of the individual commodities and I tried to highlight the related ETF's for you to trade. Understanding the implications of the commodity complex this year will probably aid immensely in understanding the global dynamics. I think you'll find the webinar a valuable hour.
Good trading,
Greg Schnell, CMT, MFTA.
