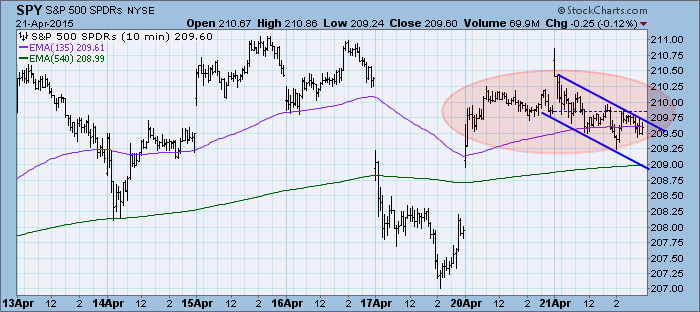
The market has been in a continuation pattern as price consolidates. Of possible interest is the ultra-short-term declining trend channel, I'm curious how it will resolve.
The purpose of the DecisionPoint Daily Update is to quickly review the day's action, internal condition, and Trend Model status of the broad market (S&P 500), the nine SPDR Sectors, the U.S. Dollar, Gold, Crude Oil, and Bonds. To ensure that using this daily reference will be quick and painless, we are as brief as possible, and often we let a chart speak for itself.
SIGNALS: Here we include the current day's signal table, an excerpt from the DecisionPoint Alert Daily Report.
DECISIONPOINT ALERT DAILY REPORT
Tuesday, 4/21/2015

************************ DECISIONPOINT MARKET POSTURE ***********************

The following is the market posture suggested by our mechanical trend-
following tools. These are not trading recommendations, rather they are price
activity flags that should be qualified by chart analysis. The Trend Model is
used on all indexes.


                                     Days   Index     04/21   Points  Percent
Index               Posture     Date Elap  @Start     Close      P/L      P/L
------------------- ------- -------- ---- -------   -------  -------  -------
Stocks Medium-Term  Bullish 10/31/14  172   199.66   209.60    +9.94    +5.0%
Stocks Long-Term    Bullish 10/31/14  172   199.66   209.60    +9.94    +5.0%
Gold (NY Spot)      Bearish 02/23/15   57  1200.80  1203.10    -2.30    -0.2%
20+Yr T-Bond  (TLT) Bullish 03/19/15   33   130.55   129.70    -0.85    -0.7%
------------------- ------- -------- ---- -------   -------  -------  -------
Dollar Index  (UUP) Bullish 07/21/14  274    21.47    25.81    +4.34   +20.2%
Commodities   (GSG) Neutral 07/14/14  281    32.64    20.70     ....     ....
Crude Oil     (USO) Bullish 04/21/15    0    19.45    19.45 * Changed Today *
------------------- ------- -------- ---- -------   -------  -------  -------
S&P 500       (SPY)     BUY 10/31/14  172   199.66   209.60    +9.94    +5.0%
S&P Equal Wt  (RSP)     BUY 11/03/14  169    77.46    82.11    +4.65    +6.0%
Dow           (DIA)     BUY 02/03/15   77   175.43   179.26    +3.83    +2.2%
Nasdaq 100    (QQQ)     BUY 10/29/14  174    99.21   108.06    +8.85    +8.9%
NDX Equal Wt (QQEW)     BUY 10/30/14  173    40.47    44.93    +4.46   +11.0%
S&P 100       (OEF)     BUY 02/04/15   76    89.49    91.86    +2.37    +2.6%
S&P 400 MidCp (IJH)     BUY 11/05/14  167   140.67   152.52   +11.85    +8.4%
S&P 600 SmlCp (IJR)     BUY 11/03/14  169   110.56   118.20    +7.64    +6.9%
Total Market  (VTI)     BUY 11/03/14  169   103.05   108.93    +5.88    +5.7%
Consumer Disc (XLY)     BUY 11/05/14  167    67.05    76.14    +9.09   +13.6%
Cons Disc EWt (RCD)     BUY 11/03/14  169    82.41    91.84    +9.43   +11.4%
Consumer Stpl (XLP)     BUY 08/20/14  244    44.00    49.32    +5.32   +12.1%
Cons Stpl EWt (RHS)     BUY 10/21/14  182    97.26   108.69   +11.43   +11.8%
Energy        (XLE)     BUY 04/09/15   12    79.79    81.35    +1.56    +2.0%
Energy EWt    (RYE)     BUY 04/09/15   12    69.34    70.16    +0.82    +1.2%
Financial     (XLF)     BUY 02/13/15   67    24.34    24.11    -0.23    -0.9%
Financial EWt (RYF)     BUY 02/05/15   75    44.13    44.32    +0.19    +0.4%
Health Care   (XLV)     BUY 10/23/14  180    63.89    74.23   +10.34   +16.2%
Health Cr EWt (RYH)     BUY 05/09/14  347   115.73   159.19   +43.46   +37.6%
Industrial    (XLI)     BUY 04/14/15    7    56.50    56.38    -0.12    -0.2%
Industrl EWt  (RGI)     BUY 02/09/15   71    88.54    90.05    +1.51    +1.7%
Materials     (XLB)     BUY 04/15/15    6    50.19    49.61    -0.58    -1.2%
Materials EWt (RTM)     BUY 04/10/15   11    86.75    86.64    -0.11    -0.1%
Technology    (XLK)     BUY 02/09/15   71    40.87    42.16    +1.29    +3.2%
Technolgy EWt (RYT)     BUY 02/05/15   75    89.42    93.18    +3.76    +4.2%
Utilities     (XLU) Neutral 02/20/15   60    45.33    44.36     ....     ....
Utilities EWt (RYU) Neutral 02/25/15   55    75.94    74.51     ....     ....

Average                               117                               +6.8%
We had a signal change on the DecisionPoint Alert Daily Report above on USO. I'll be discussing this crossover in the section on oil at the bottom of the blog.
NOTE: Mechanical trading model signals define the implied bias of the price index based upon moving average relationships, but they do not necessarily call for a specific action. They are information flags that should prompt chart review. Further, they do not call for continuous buying or selling during the life of the signal. For example, a BUY signal will probably return the best results if action is taken soon after the signal is generated. Additional opportunities for buying may be found as price zigzags higher, but the trader must look for optimum entry points. Conversely, exit points to preserve gains (or minimize losses) may be evident before the model mechanically closes the signal.
** Don't forget to sign up for tomorrow's DecisionPoint LIVE! Webinar! Click here! Using our indicators, we will be going over the general market, USO, UUP, TLT, Gold and your symbol requests. **
STOCKS: Based upon a 10/31/2014 Trend Model BUY signal, our current intermediate-term market posture for the S&P 500 (SPY) is bullish. The Trend Model, which informs our long-term outlook, is on a BUY signal as of 10/31/2014 so our long-term posture is bullish.
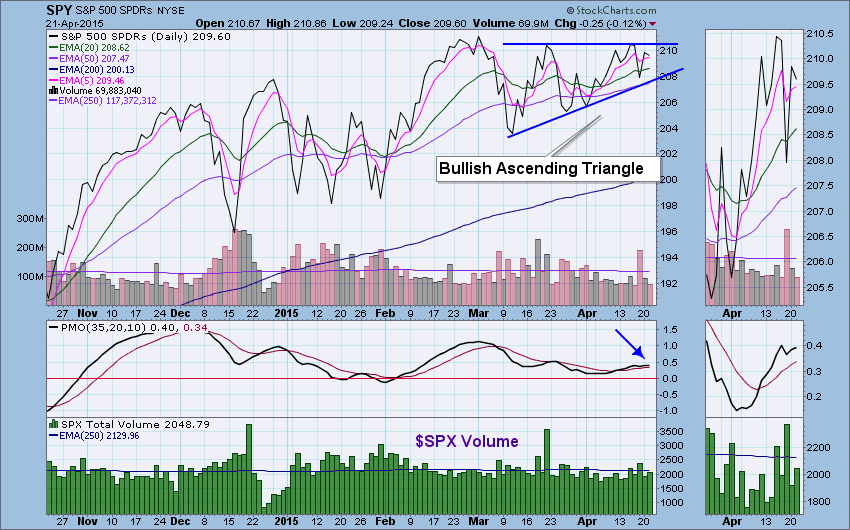
In Friday's weekly market review in the member's area DP Reports Blog, I asserted that what we could be looking at is a bullish ascending triangle. Carl originally pointed it out to me, so I will give credit where credit is due. It makes sense and is in line with how our indicators have been behaving. The PMO is twitching as the triangle begins to close in and price amplitude shrinks. The burst of volume on the pullback looks like an exhaustion.
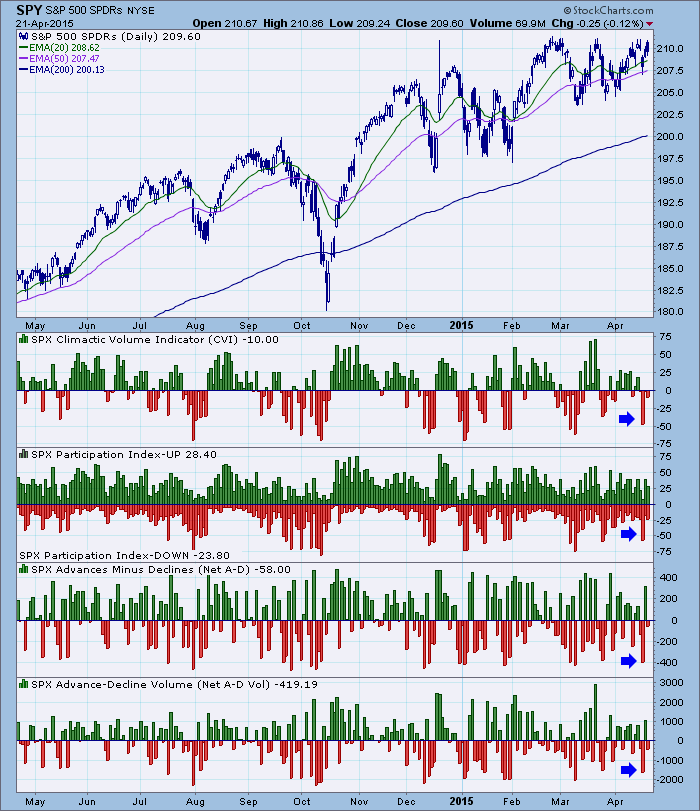
Ultra-Short-Term Indicators: The pullback also was accompanied by exhaustion climaxes on Friday. (Hindsight is 20/20, but we did review this in Friday's update as an exhaustion climax)
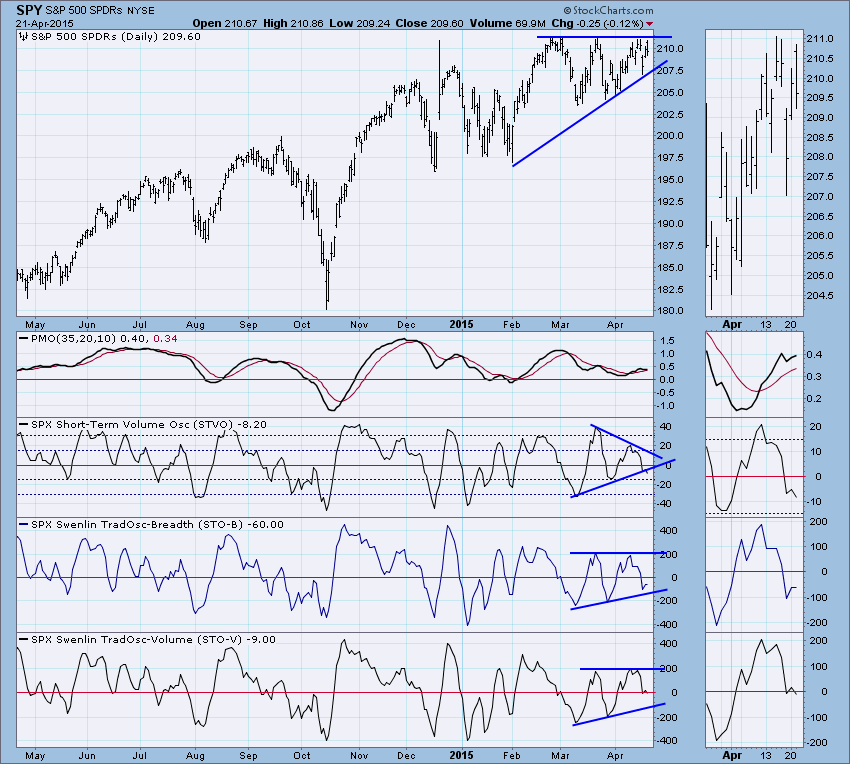
Short-Term Indicators: Short-term indicators are in somewhat triangular or wedge like formations that have not been compromised yet. Ultimately these indicators are sitting in neutral territory and therefore are neutral.
Intermediate-Term Indicators: These indicators are in a similar predicament, narrowing in while sitting in neutral. The ITBM had a negative crossover its EMA but it isn't convincing given it won't take much to whipsaw it back. The readings and EMAs are narrowing in on the zero line which isn't unusual to see in an environment of uncertainty.
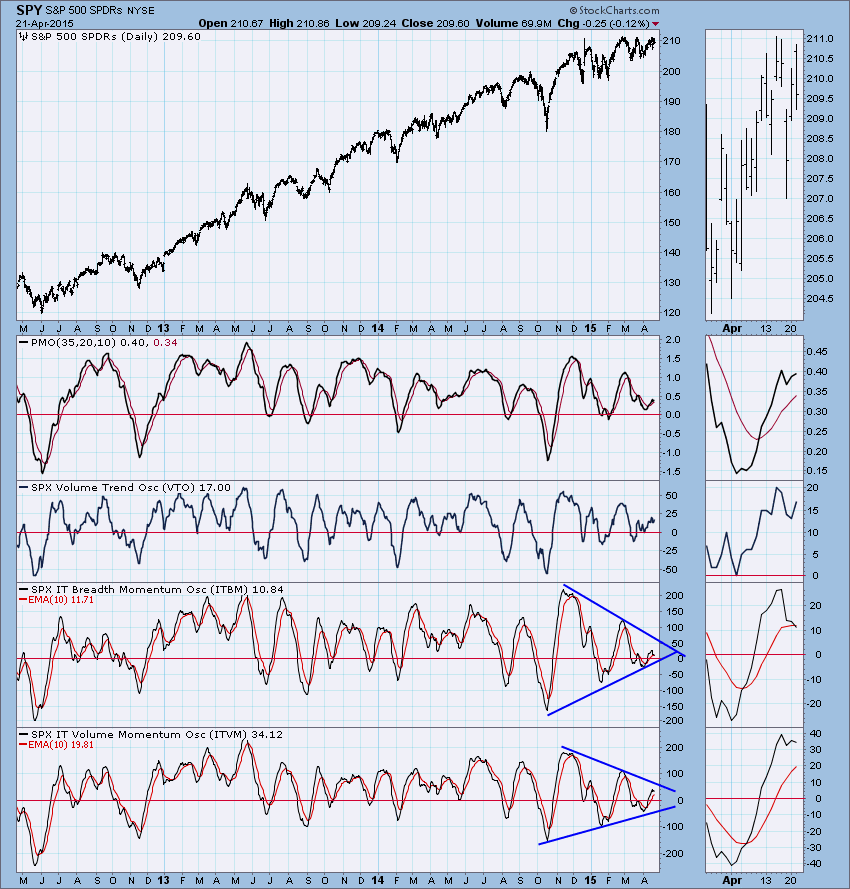
Conclusion: It looks as if we got exhaustion climaxes in volume and on our ultra-short-term indicators on Friday. This would indicate that price is now due to make another upward push. Price is making a slow move back up to likely test overhead resistance. We see a bullish ascending triangle that will execute when price finally is able to breakout above new all-time highs. That area of resistance is holding strongly, but the bulls seem poised to take the reins.
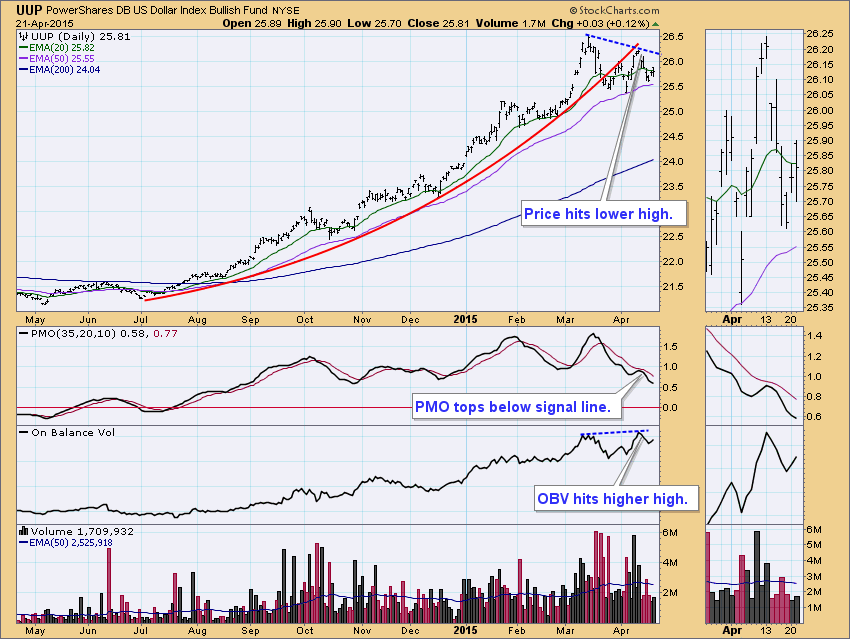
DOLLAR: As of 7/21/2014 the US Dollar Index ETF (UUP) is on a Trend Model BUY signal. The LT Trend Model, which informs our long-term outlook, is on a BUY signal as of 8/21/2014, so our long-term posture is bullish.
Carl wrote a great blog article on the dollar so I'll send you to that link here. I don't see anything more to report than he already has.
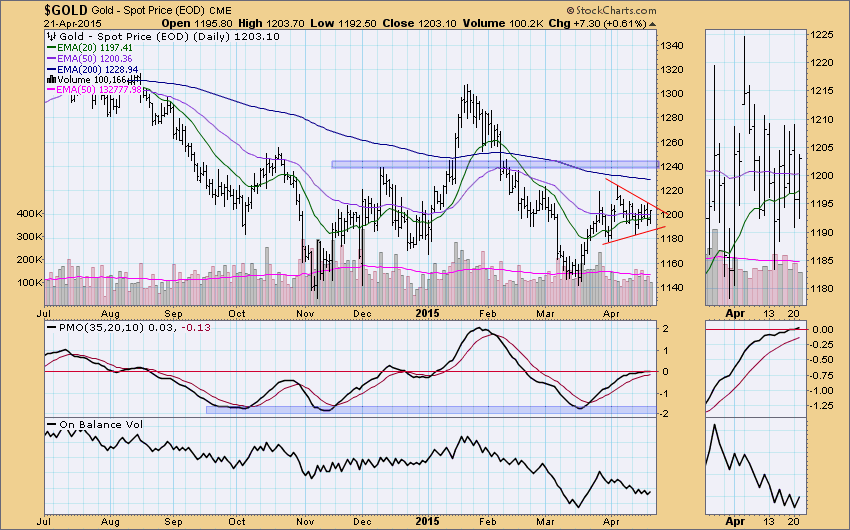
GOLD: As of 2/23/2015 Gold is on a Trend Model SELL signal. The LT Trend Model, which informs our long-term outlook, is on a SELL signal as of 2/15/2013, so our long-term posture is bearish.
Gold price narrowing within a symmetrical triangle formation. These are typically continuation patterns, meaning that we would see a breakout to continue the rally that began at the March low. In an even bigger picture, you could make a case for a bullish double-bottom drawn along the November 2014 and March 2015 lows. Many are asserting that a large head and shoulders formation is appearing, but as Carl mentioned in a previous article, HS patterns are essentially reversal patterns and this one is coming at the end of a longer-term decline so an execution would mean the continuation of lower prices....hence no reversal.
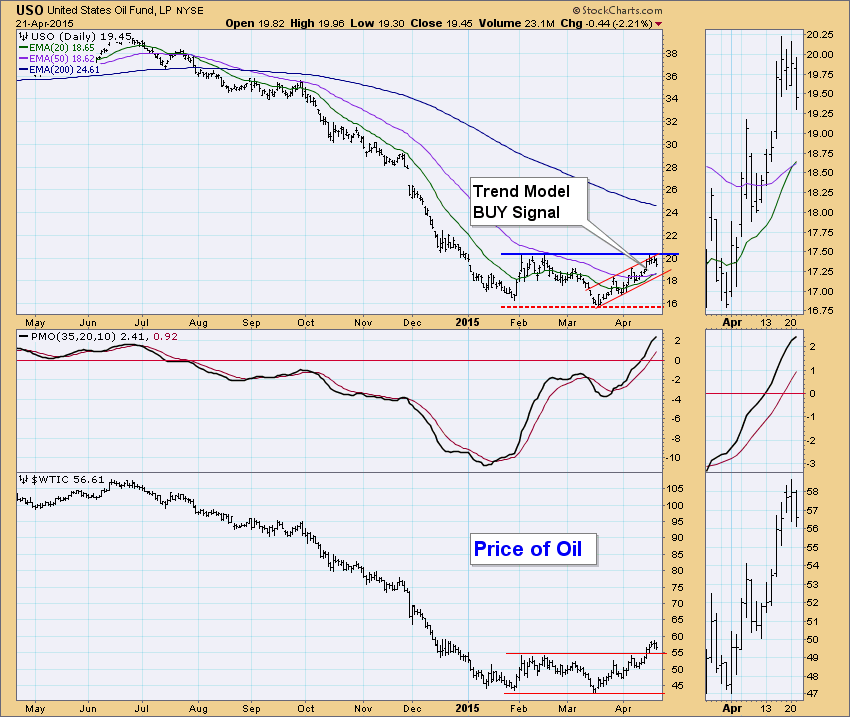
CRUDE OIL (USO): As of 4/21/2015 United States Oil Fund (USO) is on a Trend Model BUY signal. The LT Trend Model, which informs our long-term outlook, is on a SELL signal as of 8/28/2014, so our long-term posture is bearish.
The big news today is that the Intermediate-Term Trend Model generated a new BUY signal on USO. We've been watching USO travel slowly but surely up a rising trend channel. The 20-EMA finally got close enough and had a positive crossover the 50-EMA which is what generated the signal. My only concern with this signal is that price reached overhead resistance and was turned away. Although looking at the price of Oil we see that it managed to complete that breakout and price is now standing above that new support which is bullish. This signal is confirming the PMO move above zero that can be considered a measure of internal strength.
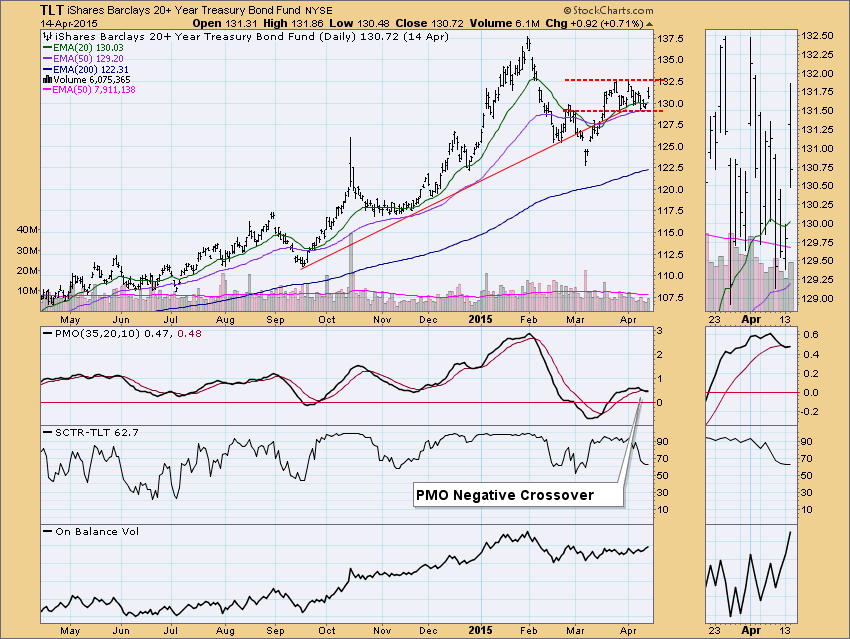
BONDS (TLT): As of 3/19/2015 The 20+ Year T-Bonds ETF (TLT) is on a Trend Model BUY signal. The LT Trend Model, which informs our long-term outlook, is on a BUY signal as of 3/24/2014, so our long-term posture is bullish.
Although today there was a nice rally, bonds are in a holding pattern. The PMO did have a negative crossover last week and has remained at a value of 0.47 since then, neither rising nor falling. Volume was up a little on today's rally, but ultimately this looks like a continuation pattern so we should look for an upside breakout.
Technical Analysis is a windsock, not a crystal ball.
Happy Charting!
- Erin


