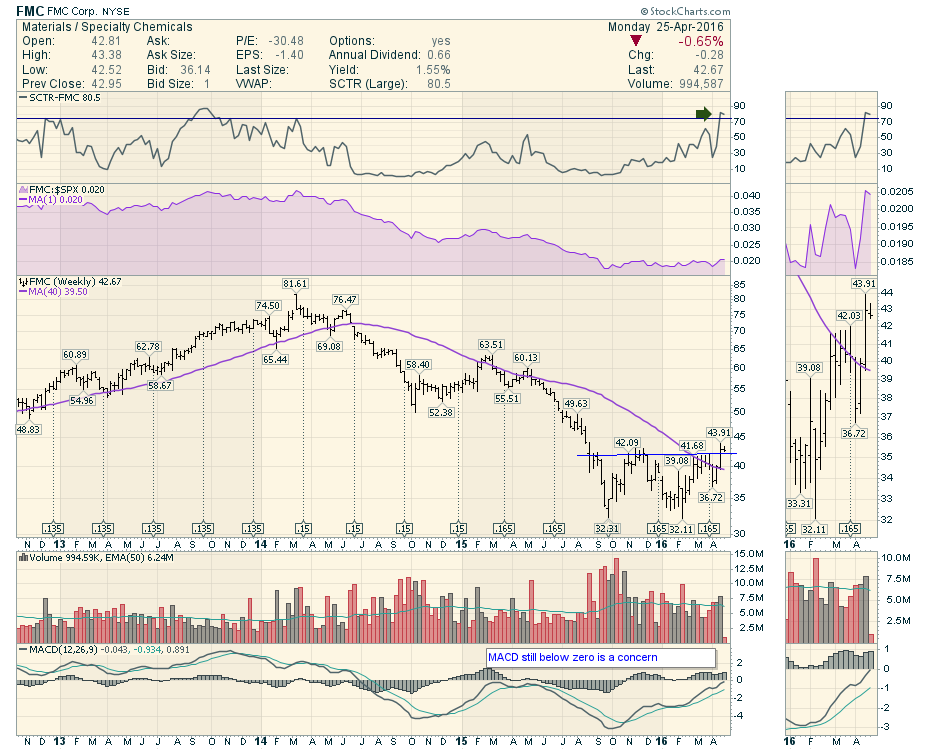
FMC Corp is a large cap specialty chemicals manufacturer in the materials sector. With three business divisions now, the agricultural arena dominates their earnings but the Lithium business is starting to perk up. The FMC chart below rolled over in June 2014. After breaking below the 40 Week MA, the price dropped by more than 50%. After a rough couple of years, is there any hope that this picks up soon?
Working through the chart, the SCTR (StockCharts Technical Ranking) has moved above 75. That puts it on my radar. The Relative Strength in purple is improving as it is up slightly to new 6-month highs with the $SPX, so improving but marginal outperformance there. The price has locked in a weekly close at the highest level in 8 months which is very encouraging. The volume is still elevated and has a strong volume week on the breakout. The main point of contention is the MACD being below the zero level suggesting this could just be a bear rally. We'll need to watch closely, but the stock is starting to behave better than at any time since 2014. That should be music to a portfolio manager's ears.
As a chemical company, it has really been a big decline that appears to be basing. Without getting into the fundamentals, this stock might get some run on an improvement in their Ag Chemicals market and Lithium. In the title of this article, I mentioned Lithium. Lithium is potentially one of the hot spaces for the next few years as it is used in the grid batteries for power storage and electric cars like the Tesla. The Lithium business is so small for FMC (5%), it is hardly worth noting. However, the rate of growth was really nice and if the rest of the business can stabilize to slightly improve, this could be the accelerator business that gives the stock upside. This could be an exciting stock to watch. I will be writing an article this week on more Lithium related stock opportunities so stay tuned for that.
If you would like to get these Don't-Ignore-This-Chart articles delivered to your email inbox, click on the big Yes button below. As a large part of the commodity space is materials related, the FMC chart is a good example of some of the basing patterns being built in commodities. Recently, the Commodities area has been on fire. You may also wish to subscribe to the Commodities Countdown articles by following this link and hitting the Yes button at the bottom of the most recent article. I also pen articles as The Canadian Technician. The energy sector has recently started to base and bounce which is broadly covered in my writing on both blogs. I would encourage you to subscribe to these articles as there currently appears to be a lot of upside in the energy sector and this area of the market may provide some nice upside potential with the technology sector seemingly pausing currently. If the Natural Resource area is up huge by the end of the year, you'll want to have been involved. I try to continually point out investable ideas.
Regarding webinars, Arthur Hill will be hosting a webinar this afternoon at 1 PM EST today. Art's Charts Live 2014-04-26. Martin Pring is the writer of Technical Analysis Explained, fifth edition and Intermarket Review, which he has written for over thirty years. Martin will be doing a free webinar this afternoon, Tuesday, April 26th at 5 EST. Martin Pring's Market Round Up Live 2016-04-26.
Both of these authors have regular articles on StockCharts.com that are for subscribers only. Your subscription to StockCharts gives you access to their work. Take the time to check it out! However, the webinars are open to everyone currently. If you have the chance, they are very informative presentations to aid in understanding the current market environment. By the way, Martin's book is currently on sale in the StockCharts bookstore at 20% less than Amazon!
Good trading,
Greg Schnell, CMT, MFTA.


