|
|
Great question from Randall came in today:
"I have tried to create a Smoothed Rate of Change indicator on one of my charts with little success. I am trying to create a "Smoothed Rate of Change " indicator. As one of the options, you offer a ROC. To create a Smoothed Rate of Change (S-RoC 13/21) calculate a 13 day exponential moving average of closing prices and apply a 21-day Rate of Change to it. This indicator is from the "Trading for a Living" book by Alexander Elder. Is it possible to create this indicator using Stockcharts?"
Yes, but right now you need to use a trick to get what you want. If we wanted to chart the ROC of an indicator, like RSI or Stochastics, then this would be easy. Just select the indicator, open the "Advanced Options" area and select "ROC" from the "Overlay" dropdown in that area.
Unfortunately EMA is not one of the choices in the Indicator dropdown. (Remember, EMA is a chart overlay which is only available in the Overlays dropdown.)
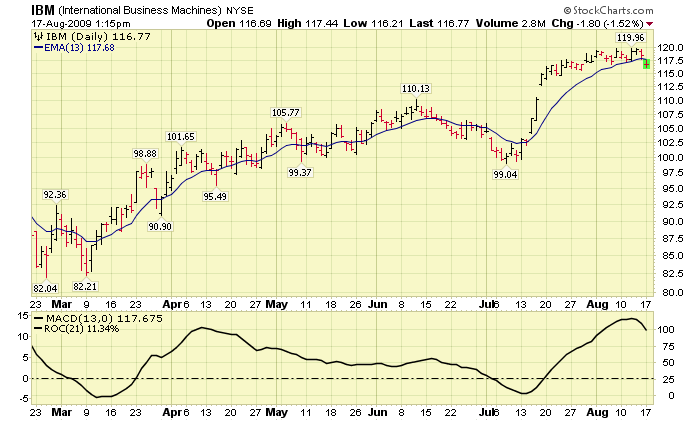
Fortunately we can use a variation of the MACD indicator to "re-create" an EMA as an Indicator. If we add the MACD to our chart with the parameters "13,0" we get the 13-day EMA that we want. This is because the MACD is defined as the value of the first EMA (13-day in this case) minus the value of the second EMA (0-day in this case). Since the value of a 0-day EMA is always 0, that means that MACD(13,0) is the same thing as EMA(13).
Now all we have to do is open the "Advanced Options" area and select "ROC" from the "Overlay" dropdown in that area, then enter "21" as the parameter.
Finally since the MACD/EMA line might be confused with the ROC line, let's set the "Opacity" to "0.0" to remove it from the chart.
And, drumroll...
Click here for a live version of this chart.
(Notes: The vertical scale for the line is on the left - the one on the right is for the invisible MACD line and should be ignored. Also, the "Advanced Options" settings that this answer uses are only available to StockCharts.com subscribers.)


