|
|
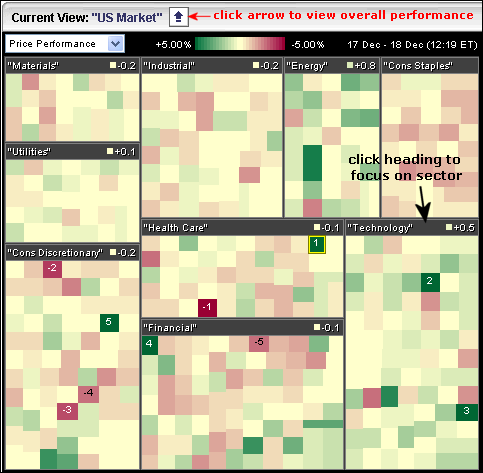
The MarketCarpet view can be changed by clicking the blue arrow at the top-left or by clicking the heading of each section. The image below shows the default S&P Sector Carpet. The nine S&P sectors are shown in big boxes and the individual stocks are represented with the small colored squares (green to red). Click on the blue arrow to see these sectors as a whole.
The next MarketCarpet shows the sector view. Now the sectors are color coded from green to red. Also notice the numbers in each header. This tells us the average gain or loss for each stock within the sector. Click a sector heading (twice) to focus on that sector.

The next market carpet focuses on the technology sector with the ticker symbols. To show/hide the tickers, hover over the carpet and right click the mouse for options. This MarketCarpet shows Oracle (ORCL), Verisign (VRSN) and Motorola (MOT) leading the way higher. Click the arrow at the top-left to return to the default view. Click on the image below to see a live MarketCarpet


