|
|
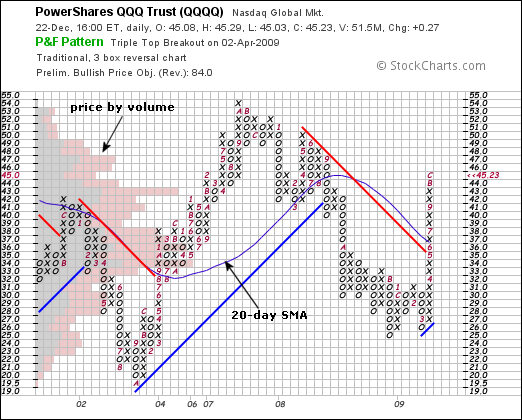
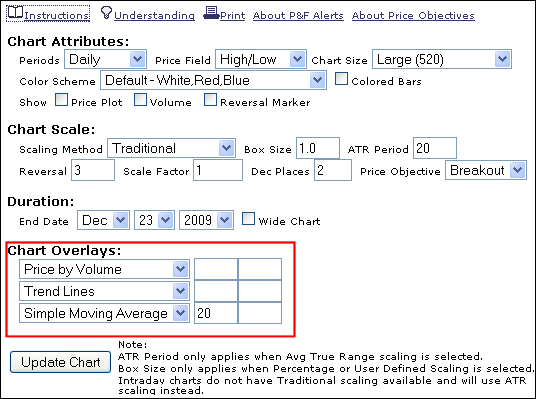
SharpCharts users can show trendlines, Bollinger bands, price-by-volume and moving averages on Point & Figure charts. The first step is to create a P&F chart. Under the P&F chart, one can choose the indicators in the “price overlays” section. In this example, I chose price-by-volume, trendlines and the simple moving average. Click “update chart” to apply these indicators. The indicators are based on the X and O levels on the Point & Figure chart. In other words, they are based on P&F prices, not on the daily price/volume of the actual security. Do not expect indicators on the P&F charts to look the same as indicators on a daily bar chart. Click the chart of image to see a live version.


