|
|
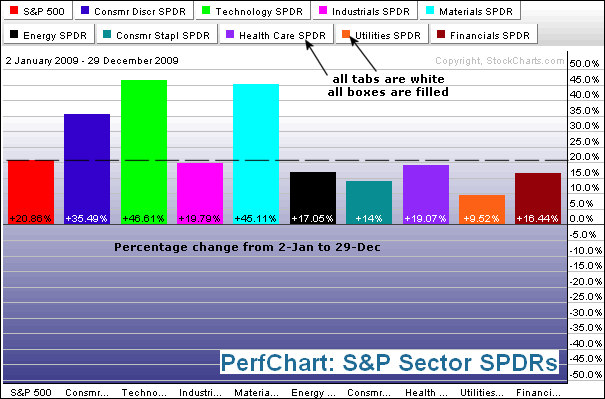
There are two ways to look at a PerfChart: absolute performance or relative performance. Absolute performance is straightforward. It is simply the percentage gain or loss over a given period of time. The first PerfChart shows the absolute change for the nine S&P Sector SPDRs and the S&P 500. Notice that all tabs are white and all boxes are filled. Click on the box to show/hide the S&P 500 or any other security in the PerfChart. A filled box shows the security, while a hollow box hides the security.
 Click this chart for details
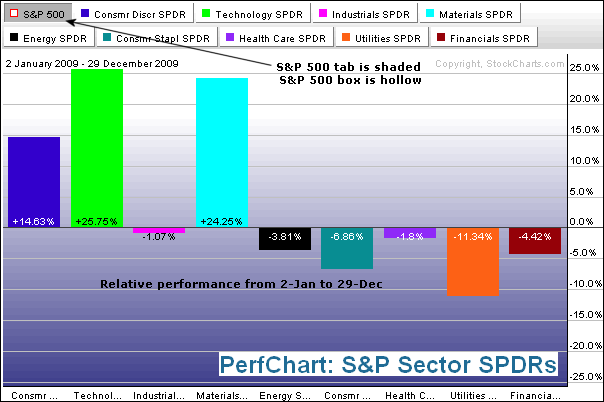
The second PerfChart shows relative performance for the nine S&P sector SPDRs. This is the default setting for the Sector PerfChart. In this example, the S&P 500 is the benchmark and performance is relative to the S&P 500. Notice that the S&P 500 tab is shaded. Click on the tab to switch from relative performance to absolute performance. Any one of these securities can be used as the benchmark by clicking their respective tabs.

Click this chart for details
Relative performance equals percentage gain/loss in the sector SPDR less the percentage gain/loss in the S&P 500. From January 2nd until January 29th, the S&P 500 advanced 20.86% and the Consumer Discretionary SPDR (XLY) added 35.49%. The Consumer Discretionary SPDR (XLY) was up 14.63% more than the S&P 500. This is the relative performance. XLY outperformed because it was up more than the S&P 500. Sectors that outperform show positive relative performance and sectors that underperform show negative relative performance.
 Click this chart for details
The second PerfChart shows relative performance for the nine S&P sector SPDRs. This is the default setting for the Sector PerfChart. In this example, the S&P 500 is the benchmark and performance is relative to the S&P 500. Notice that the S&P 500 tab is shaded. Click on the tab to switch from relative performance to absolute performance. Any one of these securities can be used as the benchmark by clicking their respective tabs.

Click this chart for details
Relative performance equals percentage gain/loss in the sector SPDR less the percentage gain/loss in the S&P 500. From January 2nd until January 29th, the S&P 500 advanced 20.86% and the Consumer Discretionary SPDR (XLY) added 35.49%. The Consumer Discretionary SPDR (XLY) was up 14.63% more than the S&P 500. This is the relative performance. XLY outperformed because it was up more than the S&P 500. Sectors that outperform show positive relative performance and sectors that underperform show negative relative performance.


