|
|
There are numerous commodity-related indices and ETFs available at stockcharts.com. In particular, the commodity-related ETFs from Powershares offer a good means to keep an eye on various commodity groups. Deutsche Bank
DB Commodity Index Fund - DBC
DB Energy Fund - DBE
DB Base Metals Fund - DBB
DB Agriculture Fund - DBA
DB Silver Fund - DBS
DB Oil Fund - DBO
DB Precious Metals Fund - DBP
DB Gold Fund - DGL
Even though these ETFs are self-explanatory, investors should know the component make-up to truly understand the driving forces. For instance, the DB Commodity Index Fund (DBC) looks like a broad-base commodity fund. However, a dive into the components and weighting reveals a heavy tilt towards the oil complex. Four of the fourteen components are oil related. That does not seem like much, but these four components account for 47.68% of the ETF (Brent Crude 11.93%, Heating Oil 11.86%, Light Crude 11.95%, RBOB Gasoline 11.94%).
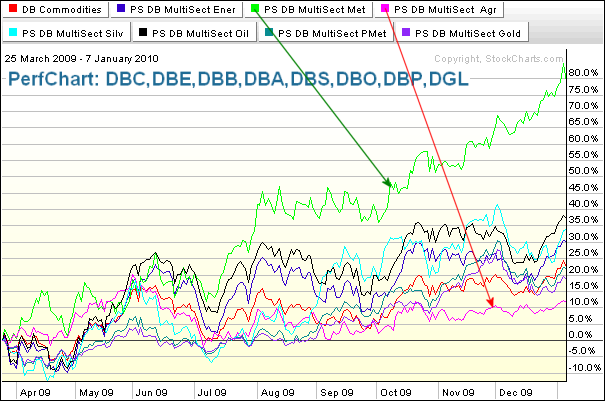
For charting and analysis, investors can look at individual charts, PerfCharts or CandleGlance charts. The PerfChart below shows the eight commodity ETFs over the last 200 days (March 25th to January 7th). The DB Base Metals Fund (DBB) is by far the best performing. The DB Agriculture Fund (DBA) is the worst performing.
 Click this chart for details
With CandleGlance charts, users can view eight small candlestick charts for a quick overview. CandleGlance settings can be adjusted at the bottom of the page. Duration can be set to 6 months and indicators can be applied to all eight charts. Click here for to see these CandleGlance charts.
DB Commodity Index Fund - DBC
DB Energy Fund - DBE
DB Base Metals Fund - DBB
DB Agriculture Fund - DBA
DB Silver Fund - DBS
DB Oil Fund - DBO
DB Precious Metals Fund - DBP
DB Gold Fund - DGL
Even though these ETFs are self-explanatory, investors should know the component make-up to truly understand the driving forces. For instance, the DB Commodity Index Fund (DBC) looks like a broad-base commodity fund. However, a dive into the components and weighting reveals a heavy tilt towards the oil complex. Four of the fourteen components are oil related. That does not seem like much, but these four components account for 47.68% of the ETF (Brent Crude 11.93%, Heating Oil 11.86%, Light Crude 11.95%, RBOB Gasoline 11.94%).
For charting and analysis, investors can look at individual charts, PerfCharts or CandleGlance charts. The PerfChart below shows the eight commodity ETFs over the last 200 days (March 25th to January 7th). The DB Base Metals Fund (DBB) is by far the best performing. The DB Agriculture Fund (DBA) is the worst performing.
 Click this chart for details
With CandleGlance charts, users can view eight small candlestick charts for a quick overview. CandleGlance settings can be adjusted at the bottom of the page. Duration can be set to 6 months and indicators can be applied to all eight charts. Click here for to see these CandleGlance charts.


