|
|
In short, the Nasdaq has easier listing requirements than the NYSE. This makes it easier for startups and high-risk companies to get a listing. Startups and high-risk companies can prosper in a strong bull market with plenty of liquidity. However, these companies suffer when liquidity is tight or during a bear market. Once listed, these companies must meet certain financial and reporting requirements or face the prospects of a delisting. The Nasdaq has many more delistings than the NYSE.
 Click this chart for details
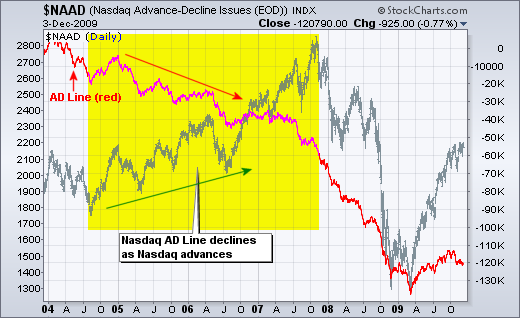
The first chart shows the Nasdaq AD Line over the last six years. Notice that the AD Line declined as the Nasdaq advanced from July 2004 to October 2007. When the Nasdaq turned down, the decline in the AD Line accelerated. Since March, the Nasdaq has advanced back to the 2008 support level (blue line). However, the AD Line remains well below corresponding levels.
 Click this chart for details
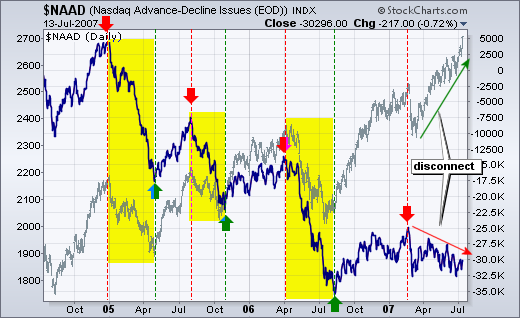
Even thought the Nasdaq AD Line has a long-term downward bias, it can be used for medium-term swings (1+ months). The second chart focuses on the Nasdaq decline from July 2004 to July 2007. The red arrows mark AD Line peaks. The green arrows mark AD Line bottoms. These correspond pretty well with Nasdaq tops and bottoms. There is, however, a big disconnect from March 2007 to July 2007. This disconnect continued until the October 2007 top. Click here for a current AD Line chart.
 Click this chart for details
The first chart shows the Nasdaq AD Line over the last six years. Notice that the AD Line declined as the Nasdaq advanced from July 2004 to October 2007. When the Nasdaq turned down, the decline in the AD Line accelerated. Since March, the Nasdaq has advanced back to the 2008 support level (blue line). However, the AD Line remains well below corresponding levels.
 Click this chart for details
Even thought the Nasdaq AD Line has a long-term downward bias, it can be used for medium-term swings (1+ months). The second chart focuses on the Nasdaq decline from July 2004 to July 2007. The red arrows mark AD Line peaks. The green arrows mark AD Line bottoms. These correspond pretty well with Nasdaq tops and bottoms. There is, however, a big disconnect from March 2007 to July 2007. This disconnect continued until the October 2007 top. Click here for a current AD Line chart.


