|
|
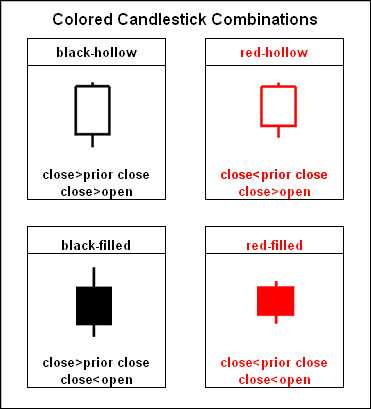
Candlestick coloring is a timely issue because many ETFs and stocks formed red-hollow candlesticks on Thursday (24-Feb-10). First, let’s review the different combinations possible. Colored candlesticks are made up of four components in two groups. First, a down close gets a red candlestick and an up close gets a black candlestick. Second, a candlestick is hollow when the close is above the open and filled when the close is below the open. The table below shows the four combinations.

Each candlestick tells a price action story. In particular, the hollow candlesticks tell us that a security moved higher after its open. A filled candlestick indicates that a security moved lower after the open. This is important information. Moving lower after the open reflects weakness, while moving higher after the open reflects strength.
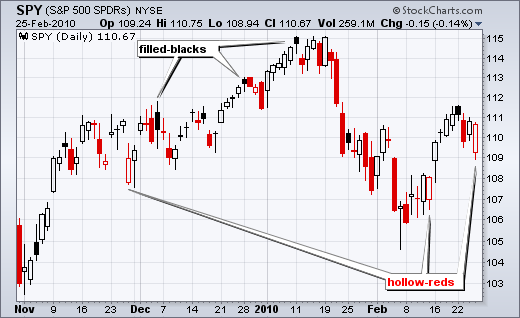
Red-hollow and black-filled candlesticks also convey important information on price action. Take for instance the red-hollow (no, it’s not a bird). Even though the close was below the prior close (red), prices managed to move higher after the open (hollow).Despite closing lower on the day, there was some evidence of buying pressure during the day. The black-filled candlestick is the opposite. Even though the close was above the prior close (black), prices moved lower after the open (filled). Despite closing higher on the day, there was some evidence of selling pressure. The chart below shows SPY with its second long-hollow-red candlestick in the last three weeks.


Posted by: Amish Shah March 02, 2010 at 21:45 PM