|
|
Slope can be used to measure relative strength or weakness. First, let’s define the indicator. Slope measures the rise-over-run of a linear regression, which is the line of best fit over a specific timeframe. A 20-day Linear Regression would show the line of best fit for closing prices over a 20-day period. A 20-day Slope would reflect the rise-over-run of this 20-day Linear Regression. If the Linear Regression rises 4 points over 2 days, then the slope would be 4 over 2 or 2 (4/2). If the Linear Regression falls 6 points over 2 days, then the slope would be -6 over 2 or -3 (-6/2). A Linear Regression with a positive Slope is rising, while a Linear Regression with a negative Slope is falling.
 Click this chart to see the settings.
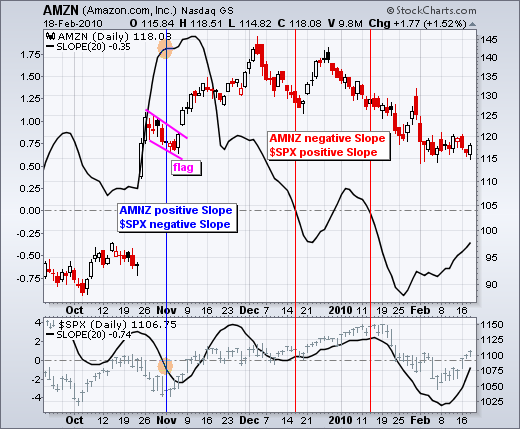
The Slope of two (or more) securities can be compared to identify relative strength and relative weakness. The chart below shows Amazon (AMZN) with the S&P 500. Both securities are shown with the 20-day Slope (black). The blue line in early November shows Amazon with a positive Slope and the S&P 500 with a negative Slope. Amazon was clearly outperforming the S&P 500 at this time. In fact, when the S&P 500 bottomed in early November, Amazon led the way higher with a move from 117 to 143. Things started to change in mid December when the Amazon Slope turned negative and the S&P 500 Slope was still positive. This situation repeated the second week of January and Amazon was showing relative weakness. Basically, Amazon’s 20-day Linear Regression was sloping down while the S&P 500 20-day Linear Regression sloping up, which was a clear discrepancy.


