|
|
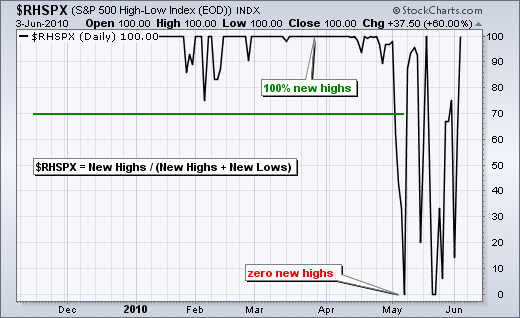
The S&P 500 High-Low Index ($RHSPX) is a breadth indicator found by dividing the number of new highs by the number of new highs plus new lows. If there are 70 52-week highs and 30 52-week lows, the indicator would be 70% (70/(70+30)). This indicator fluctuates between zero and one hundred. The chart below shows the indicator over the last seven months. It held above 70% from November to April. New highs plummeted with the stock market decline in May and this indicator hit zero in early May. This means there were zero new highs. Over the last 4-5 weeks, the indicator has been bouncing between 0 and 100 as the market trades in choppy fashion. 100% means there were no new lows.

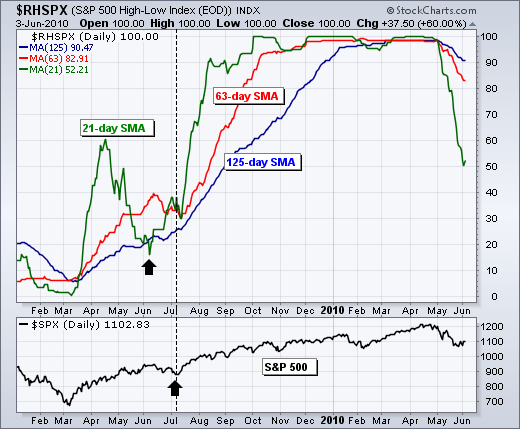
Smoothing the indicator with a moving average makes longer term analysis more practical. The chart below shows the S&P 500 High-Low Index with a 21-day, 63-day and 125-day moving average. These correlate roughly to one month, one quarter and a half year. The 21-day moving average (green) is clearly the most volatile and could be used for medium-term breadth analysis. The 63-day and 125-day moving averages are less volatile and could be used for longer-term analysis. Notice that all three turned up in March and all three turned down in May. The 21-day moving average would be the first to turn up on any rebound.

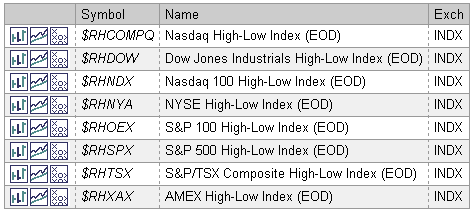
Stochcharts.com provides the high-low index for eight indices. These can be found by searching for $RH in the symbol catalog. There is also an indicator called the 10-day MA of Record High Percent Index. This is simply a 10-day SMA of the High-Low Index for the given index. A list of these can be found by searching for hilo in the symbol catalog. All of these indicators are EOD, which means the data is updated at the end of the trading day.


Smoothing the indicator with a moving average makes longer term analysis more practical. The chart below shows the S&P 500 High-Low Index with a 21-day, 63-day and 125-day moving average. These correlate roughly to one month, one quarter and a half year. The 21-day moving average (green) is clearly the most volatile and could be used for medium-term breadth analysis. The 63-day and 125-day moving averages are less volatile and could be used for longer-term analysis. Notice that all three turned up in March and all three turned down in May. The 21-day moving average would be the first to turn up on any rebound.

Stochcharts.com provides the high-low index for eight indices. These can be found by searching for $RH in the symbol catalog. There is also an indicator called the 10-day MA of Record High Percent Index. This is simply a 10-day SMA of the High-Low Index for the given index. A list of these can be found by searching for hilo in the symbol catalog. All of these indicators are EOD, which means the data is updated at the end of the trading day.


