|
|
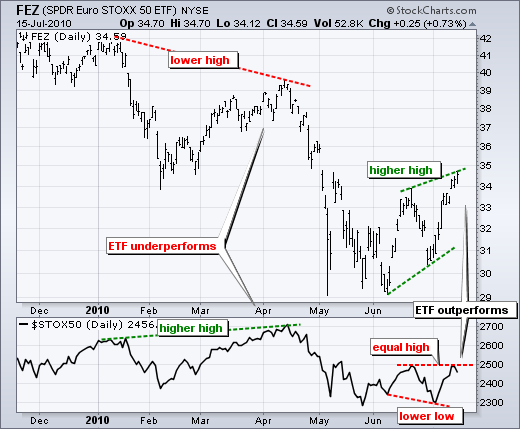
Currency movements can enhance or detract from the performance of ETFs based on foreign indices. In general, the ETFs outperform the underlying index when their currency is strong and underperform when their currency is weak. Let’s compare the Euro Stoxx 50 SPDR (FEZ) with the Euro Stoxx 50 Index ($STOX50), which are shown on the chart below. The Euro Stoxx 50 SPDR underperformed from January to April. Notice how the ETF (FEZ) formed a lower high in April as the Euro Stoxx 50 Index formed a higher high. After underperforming, the ETF (FEZ) started outperforming in June-July. Notice how FEZ formed a higher high as the underlying index failed to exceed its June high.

Click this image for details
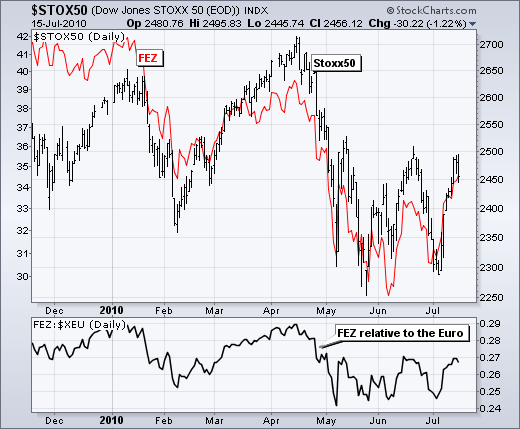
Blame the Euro. The Euro declined from January until early June. Weakness in the Euro was not reflected in the underlying index because it is already priced in Euros. Weakness in the Euro affected the Euro Stoxx 50 SPDR because it is priced in Dollars. Fund managers exchanged Dollars for Euros and then bought the European stocks. Weakness in the Euro negatively affects investments in Euro-denominated equities. Strength in the Euro positively affects investments in Euro-denominated equities. The second chart shows the Euro Stoxx 50 SPDR (FEZ) and Euro Stoxx 50 Index ($STOX50) in the top window. The indicator window shows the Euro Stoxx 50 SPDR divided by the Euro Index ($XEU). This chart shows the ETF’s performance relative to the Euro. In other words, it reflects the affects of the currency movements. This chart is more in line with the Euro Stoxx 50 Index.

Click this image for details

Click this image for details
Blame the Euro. The Euro declined from January until early June. Weakness in the Euro was not reflected in the underlying index because it is already priced in Euros. Weakness in the Euro affected the Euro Stoxx 50 SPDR because it is priced in Dollars. Fund managers exchanged Dollars for Euros and then bought the European stocks. Weakness in the Euro negatively affects investments in Euro-denominated equities. Strength in the Euro positively affects investments in Euro-denominated equities. The second chart shows the Euro Stoxx 50 SPDR (FEZ) and Euro Stoxx 50 Index ($STOX50) in the top window. The indicator window shows the Euro Stoxx 50 SPDR divided by the Euro Index ($XEU). This chart shows the ETF’s performance relative to the Euro. In other words, it reflects the affects of the currency movements. This chart is more in line with the Euro Stoxx 50 Index.

Click this image for details


