|
|
The AD Line and AD Volume Line are both breadth indicators, but the AD Line favors small-mid caps and the AD Volume Line favors large-caps. Every day there are some 3000 stocks traded on the NYSE and 2700 stocks traded on the Nasdaq. The vast majority of these are small and mid-cap issues. Large-caps are the minority.
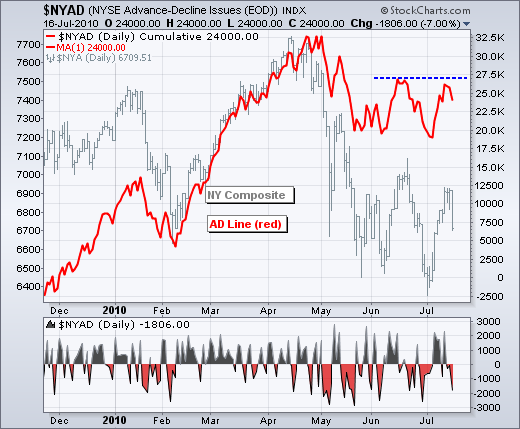
The AD Line is based on Net Advances, which is the number of advancing stocks less the number of declining stocks. An advance counts as +1 and a decline counts as -1, regardless of a stock’s market capitalization or trading volume. This means an advance or decline in Wal-mart (WMT), with a market cap around $185 billion and average daily volume of 17 million shares, counts the same as AnnTaylor (ANN), which has a market cap around $1 billion and average daily volume of 2.5 million shares. The chart below shows the NYSE AD Line and Net Advances ($NYAD). Never thought AnnTaylor would be an even match for Wal-mart.

Click this image for a live chart
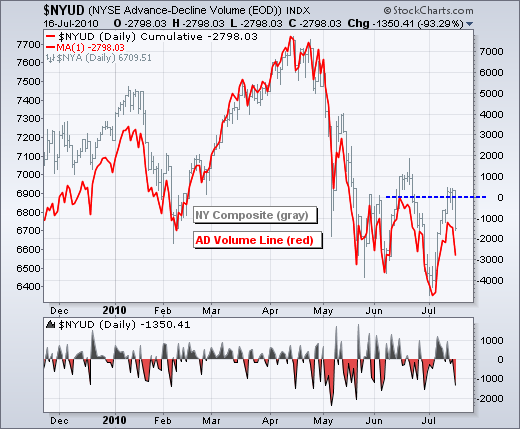
As you may have guessed, the AD Volume Line is a different story because volume counts. The AD Volume Line is a breadth statistic based on Net Advancing Volume, which is the volume of advancing stocks less the volume of declining stocks. An advance or decline in Wal-mart would affect Net Advancing Volume by some 17 million shares. However, an advance or decline in AnnTaylor would impact Net Advances by just 2.5 million shares. It is going to take a lot of AnnTaylors to make up for one Wal-Mart. This is why the AD Volume Line is weighted towards large-caps. The chart below shows the NYSE AD Volume Line and Net Advancing Volume ($NYUD).

Click this image for a live chart
The AD Line is based on Net Advances, which is the number of advancing stocks less the number of declining stocks. An advance counts as +1 and a decline counts as -1, regardless of a stock’s market capitalization or trading volume. This means an advance or decline in Wal-mart (WMT), with a market cap around $185 billion and average daily volume of 17 million shares, counts the same as AnnTaylor (ANN), which has a market cap around $1 billion and average daily volume of 2.5 million shares. The chart below shows the NYSE AD Line and Net Advances ($NYAD). Never thought AnnTaylor would be an even match for Wal-mart.

Click this image for a live chart
As you may have guessed, the AD Volume Line is a different story because volume counts. The AD Volume Line is a breadth statistic based on Net Advancing Volume, which is the volume of advancing stocks less the volume of declining stocks. An advance or decline in Wal-mart would affect Net Advancing Volume by some 17 million shares. However, an advance or decline in AnnTaylor would impact Net Advances by just 2.5 million shares. It is going to take a lot of AnnTaylors to make up for one Wal-Mart. This is why the AD Volume Line is weighted towards large-caps. The chart below shows the NYSE AD Volume Line and Net Advancing Volume ($NYUD).

Click this image for a live chart


