|
|
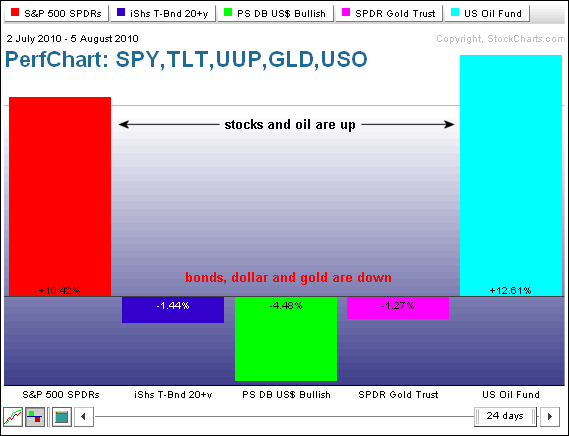
Rotation can be determined by comparing the performance of various securities over two distinct timeframes. In particular, performance metrics for intermarket related securities can shed light on risk appetite and asset class rotation. Intermarket securities include stocks, bonds, the Dollar, gold and oil. Two recent, and distinct, timeframes come to mind for comparison. Stocks declined sharply from late April until early July and then advanced sharply from early July to early August. How did the intermarket relationships change over these two timeframes?
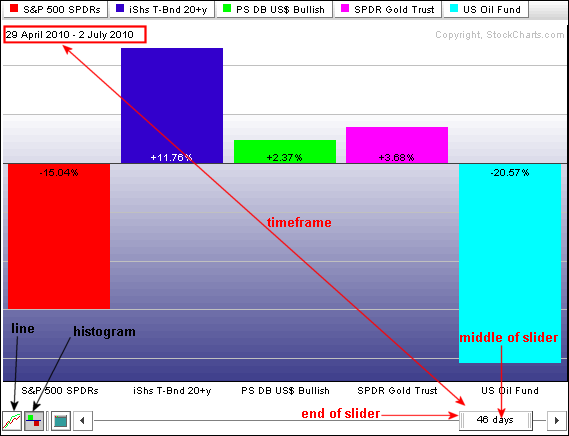
The Perfchart below shows the performance for five intermarket ETFs from late April until early July, which is when stocks declined rather sharply. The timeframe can be set with the slider at the bottom of the PerfChart. Click and drag the ends of the slider to expand or contract the timeframe. The timeframe below shows 46 days. Click and drag the middle of the slider to move right or left. The timeframe extends from April 29 until July 2. Stocks and oil declined during this timeframe. Bonds, the Dollar and gold advanced.

Click this image for a live chart
The Perfchart below shows the performance for five intermarket ETFs from late April until early July, which is when stocks declined rather sharply. The timeframe can be set with the slider at the bottom of the PerfChart. Click and drag the ends of the slider to expand or contract the timeframe. The timeframe below shows 46 days. Click and drag the middle of the slider to move right or left. The timeframe extends from April 29 until July 2. Stocks and oil declined during this timeframe. Bonds, the Dollar and gold advanced.

Click this image for a live chart

Click this image for a live chart


