|
|
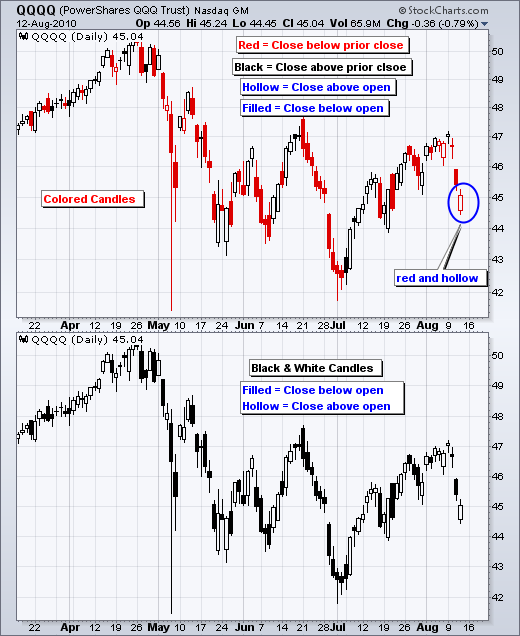
It is that time again. With a gap down on the open and bounce to close above the open, the Nasdaq 100 ETF (QQQQ) formed a hollow candlestick on Thursday. The close was also below the prior close so the candlestick was colored red. There are two types of candlestick charts: colored or black & white. Colored candlesticks convey information on the close versus the previous close. A candlestick is red when the close is below the previous close and black when the close is above the previous close. The August 12th candlestick is both red and hollow, which means the close was below the previous close and the close was above the open.

Click this image for a live chart
Black & white candlesticks focus exclusively on the relationship between the close and open. All candlesticks are black, even if the close is below the previous close. There are only two types of candlesticks here: filled and hollow. Same definitions apply. A candlestick is filled when the close is below the open and hollow when the close is above the open. Candlestick analysis is mostly focused on the relationship between the open and the close. The open reflects the reaction to news overnight or pre-market. The close reflects the reaction after the open. In general, a move higher after a weak open is positive and a move lower after a strong open is negative. The pre-defined scans page features scans for filled black candlesticks and hollow red candlesticks. Thursday’s results show 975 hollow red candlesticks on the NYSE and 542 on the Nasdaq. This means a lot of stocks moved higher after a weak open, but still closed below their previous close.


Posted by: Mary Hyatt August 13, 2010 at 05:28 AM
Posted by: Amish Shah August 15, 2010 at 17:15 PM