|
|
Most of the indicators available in SharpCharts can also be applied to cumulative breadth indicators, such as the AD Line or AD Volume Line. As with a normal stock or ETF, these indicators can help determine the trend or identify momentum shifts in breadth. The indicator signals are the same for a cumulative breadth line, a stock, index or ETF. Even with the AD Line, chartists can look for divergences in momentum indicators, moving average crossovers or Bollinger Band squeezes.

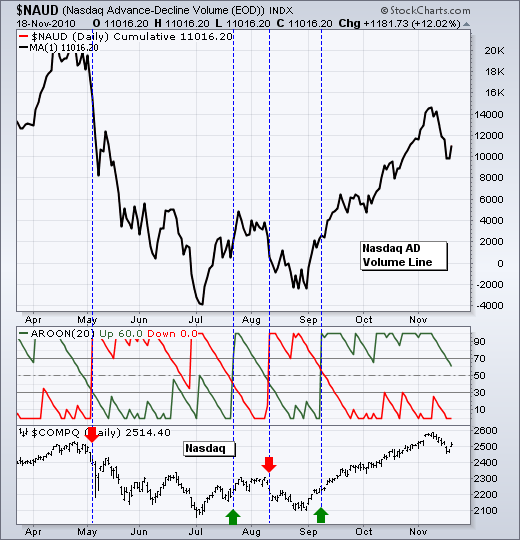
Click this image for a live chart
The chart above shows the Nasdaq AD Volume Line with Aroon in one indicator window and the Nasdaq in the other. The Aroon indicators are applied to the AD Volume Line because it is in the main charting window. The Nasdaq is shown for reference. AD Line signals occur when Aroon-Up and Aroon-Down cross. There was a bearish cross in early May 5th, a bullish cross on July 22nd, a bearish cross on August 11th and finally a bullish cross on September 9th. These signals can help define a trading or investing strategy for the broader market.


