|
|
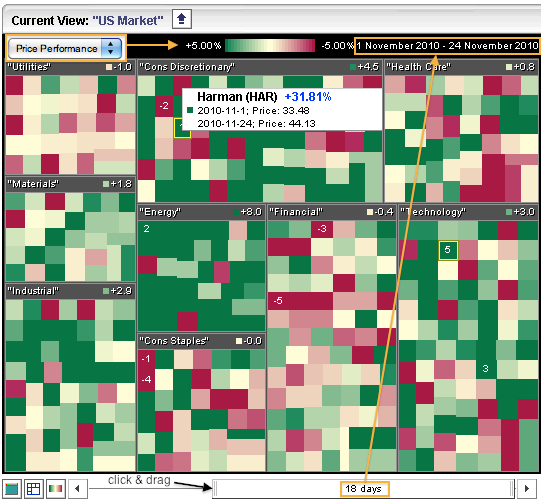
The market carpet can be used to find sectors and stocks showing relative strength or relative weakness. Starting with the S&P Sector Carpet, users can select the desired timeframe using the slider at the bottom. Click the left end and drag left to expand the number of days. Alternatively, right click on the slider to quickly select a set number of days. This carpet runs 18 trading days, which covers November. Notice how the colors change as the slider extends. The whole slider can be moved by clicking the center and dragging left or right.

Click this image for a live example.
The upper left shows this as a “price performance” market carpet with a range from +5% to -5% for colors. The up shade goes from light green for positive values to dark green for stocks that are up 5% or more. The down shade goes from light red for negative values to dark red for stocks that are down 5% or more. For reference, the S&P 500 is up +1.25% over this timeframe. Stocks showing a gain greater than 1.25% are outperforming or showing relative strength. Stocks with a loss or gain less than 1.25% are showing relative weakness. Users can hover over the squares with the mouse pointer to see the stock’s name and price change.


