|
|
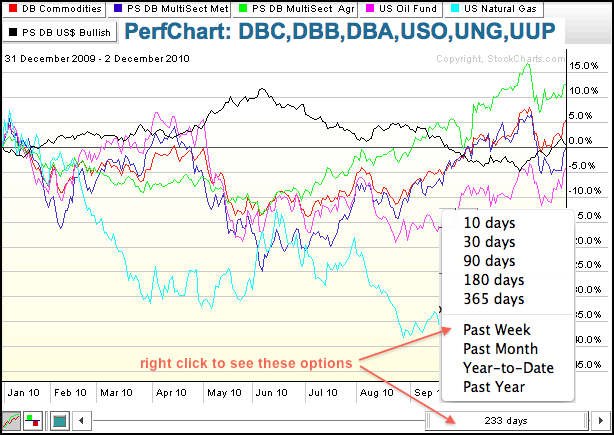
PerfCharts are the classic way to create performance charts that can compare up to 10 different securities using daily data. These are nifty because users can dynamically change the look-back period with the slider at the bottom. Users can also view these as line charts or in histogram format. The PerfChart below shows the performance for six different commodity ETFs in 2010. Users can even choose from a set of look-back options by clicking the slider with the right mouse button.

Click this image to see a live chart.
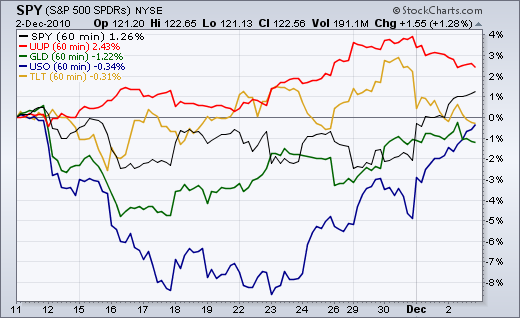
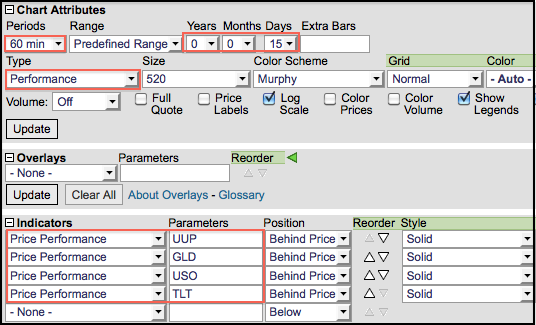
SharpCharts subscribers can create intraday performance charts with up to six symbols. Enter ticker in the symbol box at the top left and choose “performance” as the chart “type”. Select your desired periods (60 min, 30 min, 10 min) and the date range. Add additional securities by selecting “price performance” as an indicator and entering the symbols in parameters box. The chart below shows the performance of the five inter-market ETFs over the last 15 days using 60 minute periods.


