MailBag April 29, 2011 at 09:38 AM
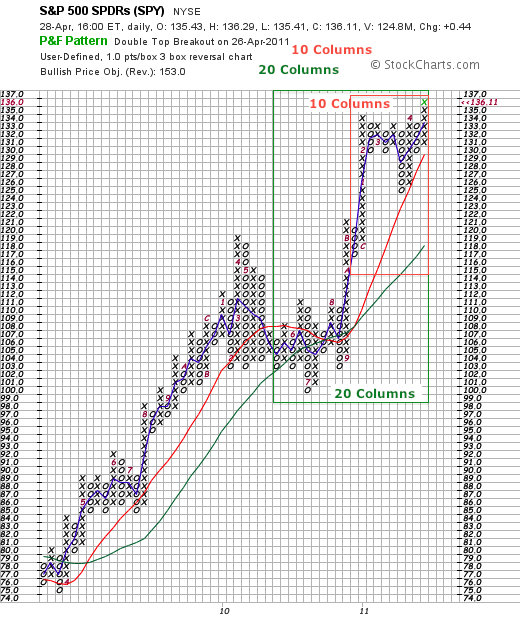
Moving averages on Point & Figure charts are based on the average price of each column. Let’s start with a 1-period SMA for an easy example. If an X-Column extends from 131 to 136, then the 1-period SMA would be 133.5 {(131 + 136)/2 = 133.5}. The chart below shows SPY with the most recent X-Column. There are six X’s extending from 131 to 136. The blue 1-day SMA is currently in the exact middle of that column (between the 3rd X and the 4th X). The red line shows a 10-period SMA and the green line shows a 20-period SMA. A 10-period SMA is the average price of the last 10 columns, which Read More
MailBag April 21, 2011 at 02:00 PM
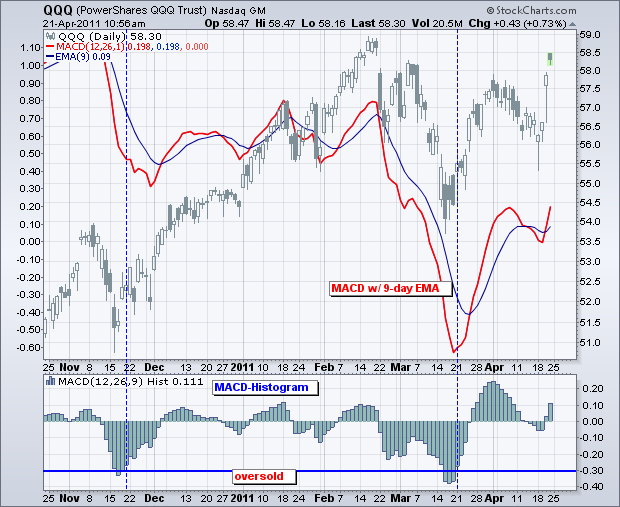
The MACD histogram measures the difference between MACD and its signal line, which is the 9-day EMA of MACD. This makes it an indicator of an indicator. Like MACD, the Histogram fluctuates above/below the zero line and produces bullish/bearish divergences. This indicator can be used to predict turns in MACD and, by extension, the underlying security. MACD-Histogram can also be used to define overbought and oversold conditions. The chart above shows the Nasdaq 100 ETF (QQQ) with MACD behind the price plot and the MACD-Histogram in the lower window. Chartists can look back at the prior Read More
MailBag April 15, 2011 at 09:27 AM

RSI is a momentum oscillator with a 14-period default setting. Sometimes the default setting is not sensitive enough to generate both overbought and oversold readings. Often, a strong uptrend will generate several overbought readings, while a strong downtrend will generate several oversold readings. In fact, oversold readings are often none-existent in a strong uptrend (and visa versa). The chart below shows SPY with 14-day RSI overlaid the price plot. 14-day RSI has not reached oversold levels (<30) in over a year. Even during the May-June decline, the indicator did not break below Read More
MailBag April 08, 2011 at 09:34 AM

A cumulative indicator creates a running total of the periodic values for an indicator. Basically, this indicator adds the periodic value when positive and subtracts the periodic value when negative. While cumulative can be applied to any symbol in the StockCharts.com catalog, this selection will produce a straight line when applied to stocks, ETF, indices or similar securities. The S&P 500, Microsoft or the Finance SPDR are always positive so the cumulative line will simply keep moving higher in a virtual straight line. The cumulative line is best suited for breadth indicators that Read More