|
|
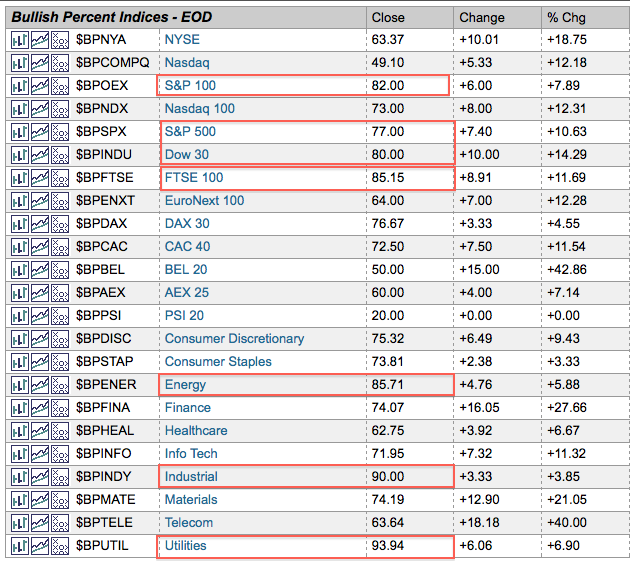
The Bullish Percent Indices (BPIs) measure the percentage of stocks in an index that are on a P&F buy signal. This means the stock is on a double top breakout signal, which means the most recent X-Column exceeded the prior X-Column. At its most basic, the Bullish Percent Index favors the bulls when above 50% and the bears when below 50%. The cup is more than half full above 50%, but more than half empty below 50%.
Click here for a live market summary.
StockCharts.com offers Bullish Percent Indices for a number of US indices, the 10 S&P sectors and a number of European indices. Chartists can view these on the end-of-day market summary page. The BPIs are updated after the close each day. Using the groupings on the market summary page, chartists can also quickly identify the leaders and laggards. The S&P 100, Dow Industrials and S&P 500 have the highest Bullish Percents and are leading the US markets. The FTSE 100 has the highest Bullish Percent for Europe. Of the 10 S&P sectors, the energy, industrials and utilities sectors have the strongest BPIs. You can read more on the Bullish Percent Index in our ChartShool Article.


