|
|
Before explaining the details, note that all the features available on the ChartNotes Annotation Tool can be found on our support page under “How to Use Our Charting Tools”. No need to go there just yet because I will explain the process. Keep this in mind to answer future questions.
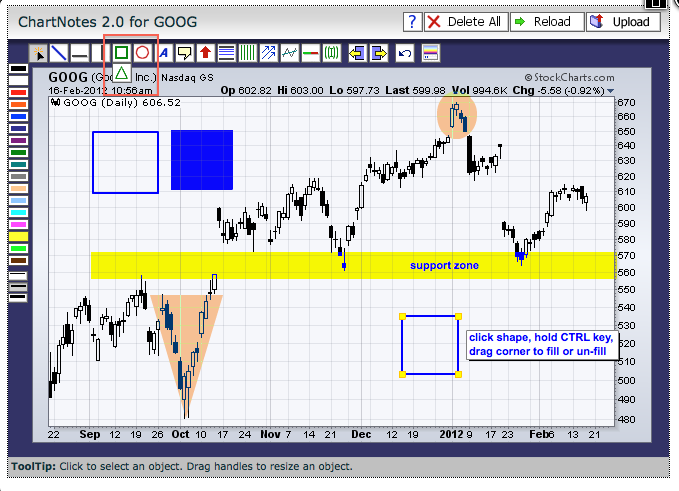
A shaded area can be created by using the square, circle or triangle features in the drawing tool bar at the top of the Annotations Page. Note that the triangle feature is located behind the square. Here are the steps:
1. Select the appropriate shape with a left mouse click
2. Select a color with a left mouse click
3. Move to the desired chart area and hold the CTRL key
4. Left mouse click and hold that click down
5. Drag to desired size and release to finish
Click this image for a live chart.
This shape can be moved by clicking the shape, holding the click and dragging. This shape can be resized by clicking the shape, clicking the yellow corners, holding the click and dragging. Users can also fill and un-fill the shape by clicking, holding and dragging a corner of the shape while holding the CTRL key. This feature is good for marking support or resistance zones. Note that Mac users would use the “command” key in place of the CTRL key.


