MailBag July 26, 2012 at 03:06 PM
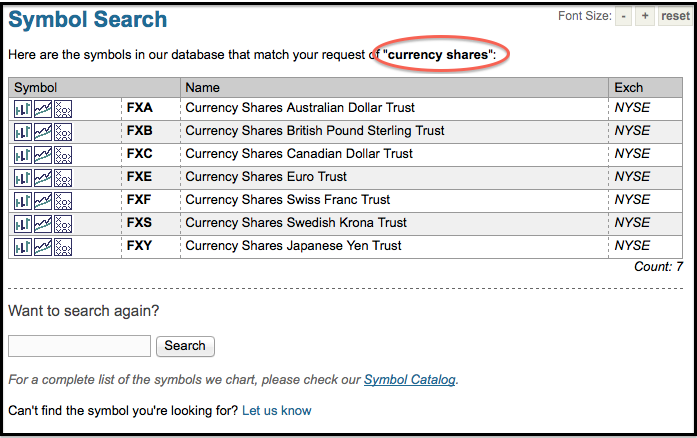
The symbol catalog is the first place to start when looking for a specific security or group of securities. For currencies, there are a few currency indices from the Philadelphia exchange. Users can search for the term “Philadelphia” to see these or click here. Alternatively, users can search for the term “Currency” to see all currency related ETFs, ETNs and funds. There are dozens of these, but the “Currency Shares” are the most popular for trading. Click this image for a live search Read More
MailBag July 22, 2012 at 05:41 PM
Hello Fellow ChartWatchers! At StockCharts.com, we go to great lengths to make sure that our indicator values are calculated correctly as discussed in that article. Here's a repeat article from 2010 that talks about how we work hard to make sure that the data used in those calculations is as accurate as possible. Enjoy. - Chip On Data Accuracy at StockCharts.com First off, I want to talk about the differences between intraday data and daily data with respect to accuracy. The key thing to keep in mind here is that after the stock markets close, the daily Read More
MailBag July 21, 2012 at 04:00 PM
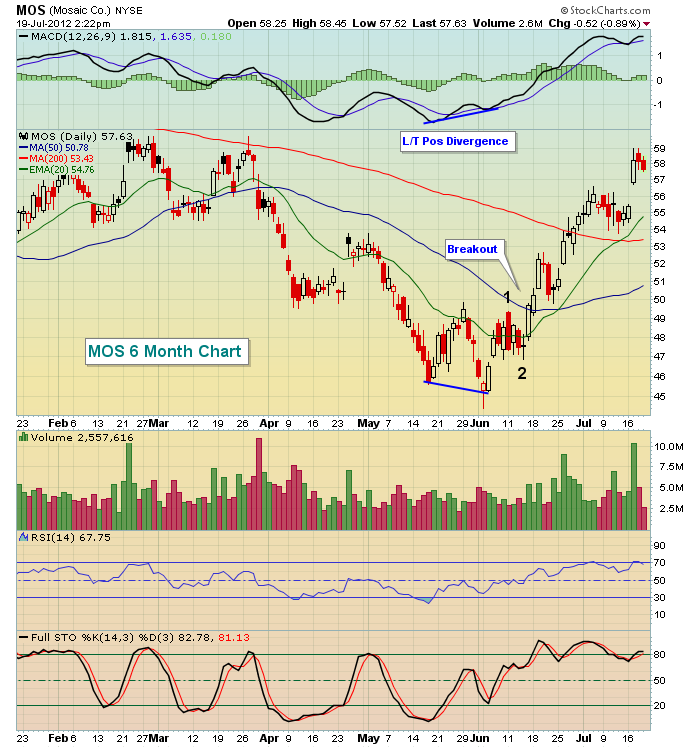
I know many traders view the MACD to be a lagging indicator and technically it is. After all, the calculation of the MACD uses historical price data so how could it not be a lagging indicator? Well, I can only tell you that I use the MACD for advanced calls quite a bit. Recently, when crude oil was plummetting, it flashed a long-term positive divergence and VOILA! prices rebounded. You can check out my last article to see the lower crude oil prices accompanied by a higher MACD reading. The interesting part is whether the positive divergence means the selling Read More
MailBag July 21, 2012 at 03:52 PM
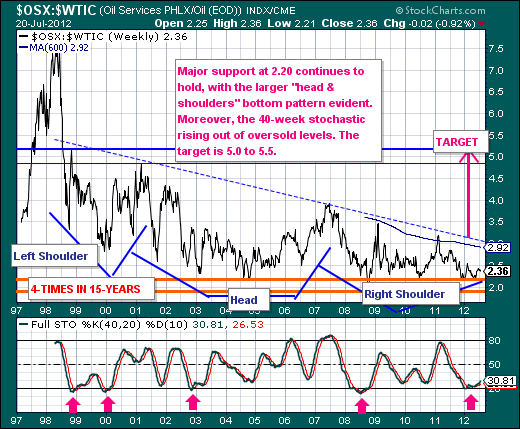
The current market environment is rather difficult to be sure; but the moving of the chess pieces underneath the market surface is what interests us at present. We are focused upon the Energy Sector (XLE) in general, and the Oil Services Group (OSX) in particular. To this end, we find OSX moving higher in absolute terms, but also poised to move higher in relative terms versus Crude Oil ($WTIC) and the S&P 500 ($SPX). Thus, we want to be overweight either the stocks that make up the OSX (SLB, BHI, NBR and others) or the Oil Services ETF (OIH). Looking at the technicals in Read More
MailBag July 21, 2012 at 03:47 PM
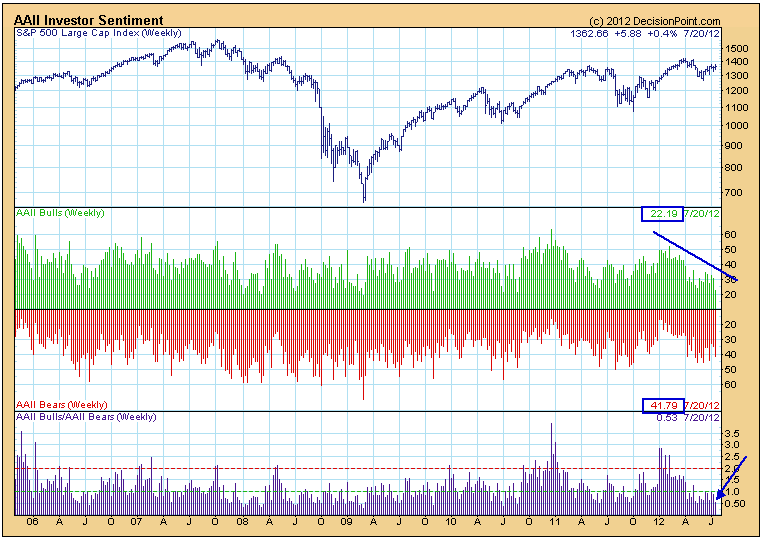
Last week the Rydex Ratio was displaying very bullish sentiment, and that is still the case. In rather stark contrast AAII Investor Sentiment* (American Association of Individual Investors) reflects very bearish sentiment this week, with 22% bulls and 42% bears. The ratio of bears to bulls is 0.53. These are levels typically seen at market bottoms, not during price advances. Looking at the chart we can see that the percentage of bulls is much lower in the last three months than it was during the first quarter. And even though the market has been rallying for about seven weeks Read More
MailBag July 21, 2012 at 03:39 PM
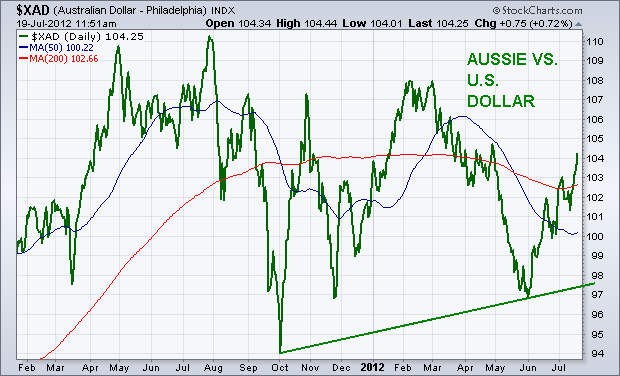
Currency trends often us something about the mood of global traders, and which way they're starting to lean. In the ongoing battle between "risk-on" and "risk-off" trades, one of the markets worth keeping an eye on is the Australian Dollar. For a number of reasons, global traders buy the Aussie when they're turning more optimistic on global stocks and commodities. That's why the recent upturn in the Aussie Dollar may be a sign of a bit more optimism among global traders. Chart 1 plots the Australian Dollar (XAD) against the U.S. Dollar over the last eighteen months. The XAD has been Read More
MailBag July 20, 2012 at 10:43 AM
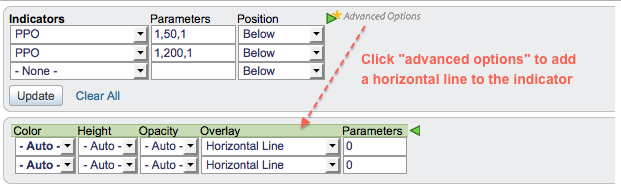
The Percent Price Oscillator (PPO) can be used to measure the percentage distance between the closing prices and an exponential moving average. PPO measures the percentage distance between two exponential moving averages. When selecting this indicator, there are three numbers to set in the parameters. The first number is the short EMA, the second number is the long EMA and the third number is the signal line. Setting the short EMA to “1” means its value will equal the closing prices for the underlying security, in this case the Dow Industrials. The second number sets the long EMA. The Read More
MailBag July 13, 2012 at 08:49 AM
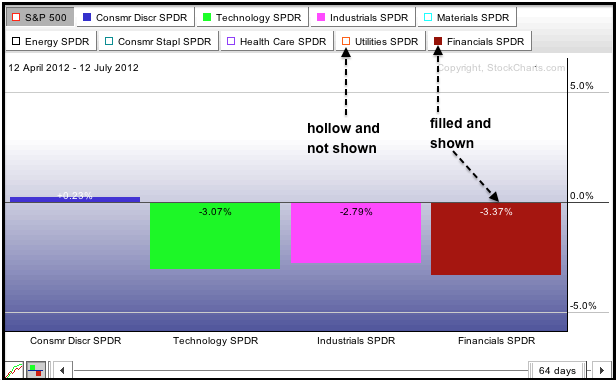
The S&P Sector Perfchart starts by showing relative performance for the nine sector SPDRs. Relative performance equals the percentage change in the SPDR less the percentage change in the S&P 500. Sectors outperforming the benchmark S&P 500 will show positive relative performance, while sectors underperforming will show negative relative performance. Chartists sometimes want to focus on specific sector groups, such as the four offensive sectors or the three defensive sectors. Sectors can be added or removed from the chart by clicking the small colored squares next to the SPDR Read More
MailBag July 06, 2012 at 10:19 AM
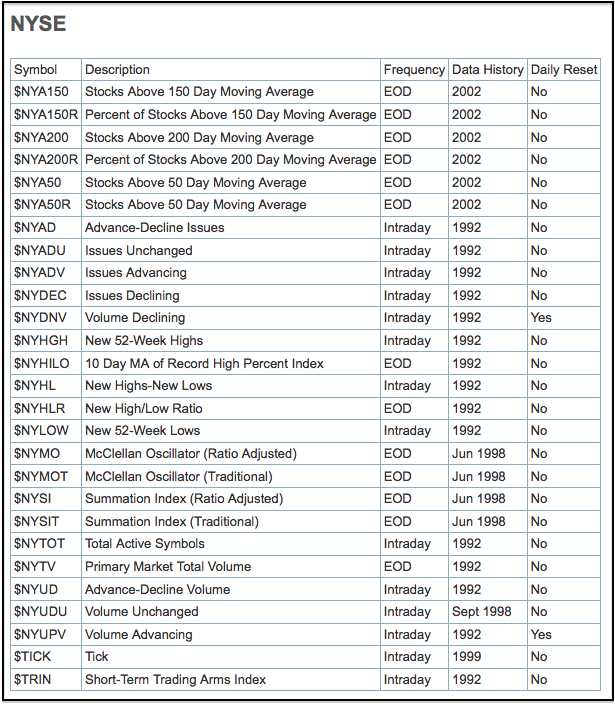
StocksCharts.com covers dozens of broad market indicators for the NYSE, Nasdaq, Amex, Toronto and Venture exchanges. Symbols for these key indicators can be found on the "Market Indicator Dictionary" page. Many of these are considered breadth indicators because they measure internal strength or weakness. Chartists can track Net Advances (advances less declines), Net New Highs (new highs less new lows), Net Advancing Volume (advancing volume less declining volume), the TICK, the TRIN and much more. Also check out our ChartSchool article on market indicators for details on using these key Read More