MailBag August 31, 2012 at 09:21 AM

Chartists can focus on one sector by starting with the Sector Market Carpet covering all nine sectors. Each sector is labeled with a heading at the top. Click on this heading to expand that sector and focus on the stocks within the sector. Click this image for a live version The example below isolates the technology sector. Chartists can see more options by hovering over a square and clicking the right mouse button. In particular, users can show the ticker symbols in each square to see which stocks are in the Read More
MailBag August 24, 2012 at 08:35 AM

StockCharts.com carries an array of symbols for spot commodity prices. Users simply need to search for “spot price” in the symbol catalog. Here you will find some 16 spot commodity prices that are updated at end-of-day (EOD). These charts are good for comparing to ETFs that track the underlying commodity. Click this image for a live search. Chartists can also find commodity related ETFs by searching for the fund family or for something specific in the name. A search for “iPath Dow” will return 19 commodity Read More
MailBag August 17, 2012 at 10:17 AM
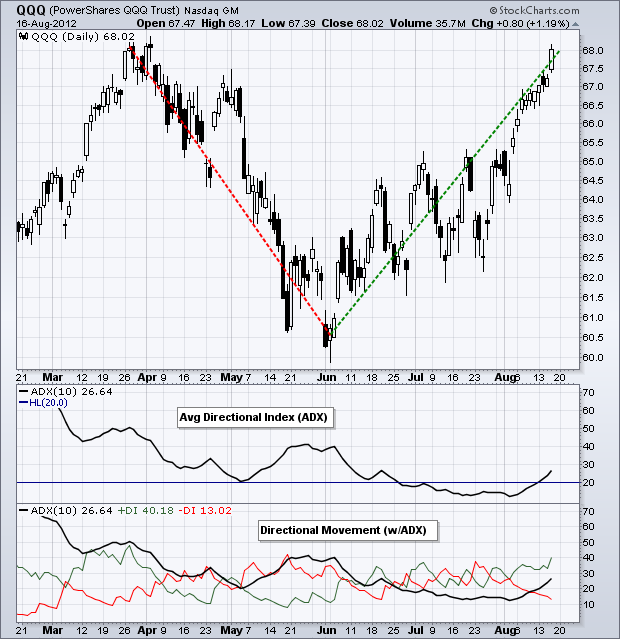
StocksCharts.com now provides two versions of the Average Directional Index (ADX). In the indicators drop down list, chartists can choose between Avg Directional Index (ADX) and Directional Movement (w/ADX). The first version shows ADX by itself, usually as a single black line. ADX measures the strength of the trend and does not have a directional bias. High ADX readings (>20) reflect a strong trend, while low ADX readings (<20) reflect a weak trend or possible trading range. The chart above shows QQQ with the two versions. I chose 10 periods instead of 14 to increase indicator Read More
MailBag August 10, 2012 at 02:33 PM

SharpCharts users can shift moving averages by adding a comma and number to the parameters box. A comma and -50 would shift the moving average back 50 periods, while a comma and 50 would shift it forward 50 periods (see settings example below). Chartists will need to add at least 50 periods (extra bars) to the chart to see this forward shift. Users can use the same technique to shift other moving average based indicators, such as Bollinger Bands, Keltner Channels, Moving Average Envelopes and Price Channels. Read More
MailBag August 04, 2012 at 04:10 PM
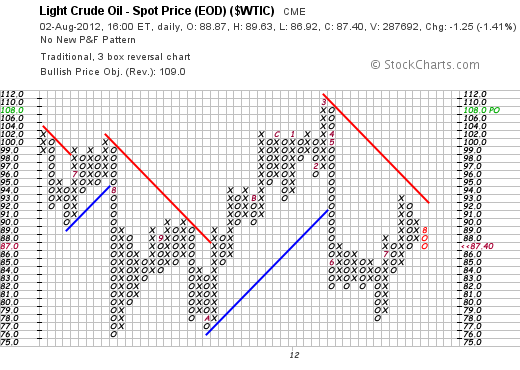
On Thursday August 2, $WTIC crude made an interesting turn. Currently crude is in a downtrend denoted by the red line.We have started August creating a downward column of O's. The Red 8 shows the first box in August with a move of at least $3.You can see that since June (The red 6), we were stuck in a range into July. In July (Red 7) Crude was able to push above $87. It then pulled back, roared to $93 and has since settled back to sit just around the previous support / resistance level built in June.Upside: If Oil can rally from this level, it would be very bullish. A push through to $93 Read More
MailBag August 04, 2012 at 06:40 AM
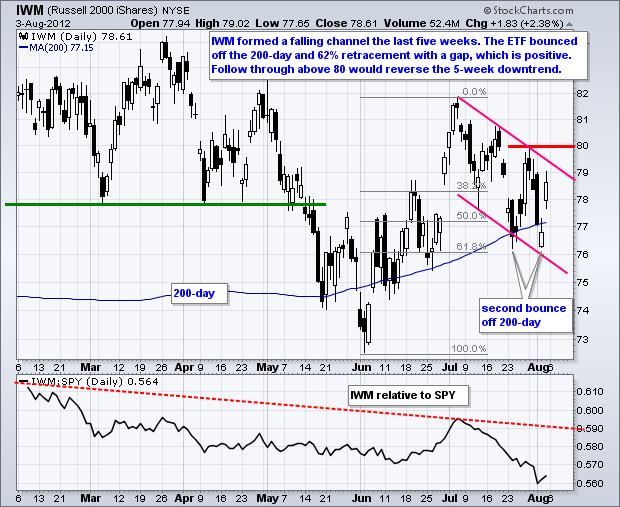
Stocks turned a negative week into a positive week with a sharp advance on Friday. The S&P 500 ETF, Dow Industrials SPDR and Nasdaq 100 ETF recouped their early week losses and exceeded their July highs. The Russell 2000 ETF (IWM) and S&P MidCap 400 SPDR (MDY), however, recovered a portion of their early week losses and have yet to exceed their mid July highs. In other words, these two remain short of breakouts and have yet to confirm strength in the other three. For now, three of the five are in clear uptrends and the bulls have the edge. I will be watching IWM and MDY to see if Read More
MailBag August 03, 2012 at 10:11 AM

StockCharts.com subscribers can create a favorites list and add symbols from a specific index, average, sector or industry group. The major indices are covered, including the Nasdaq 100, S&P 500, S&P MidCap 400 and S&P SmallCap 600. The Dow Industrials, Dow Transports and Dow Utilities are included. Subscribers can also make lists with sector components from all nine sectors. Chartists wishing to get even more specific can choose from over 50 industry groups, which are further down the dropdown menu. Once this list is Read More