|
|
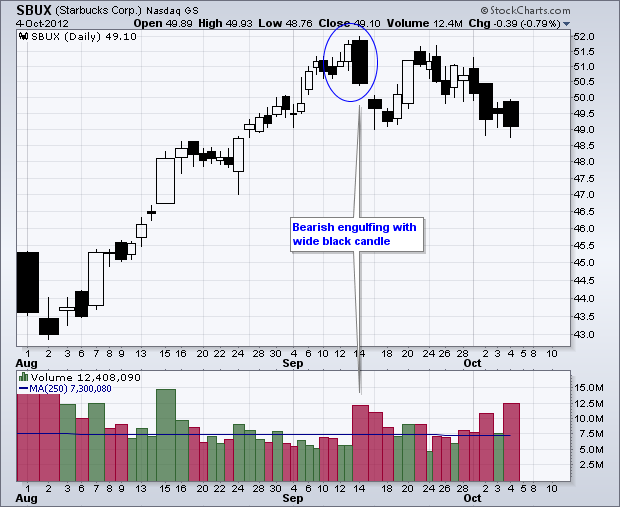
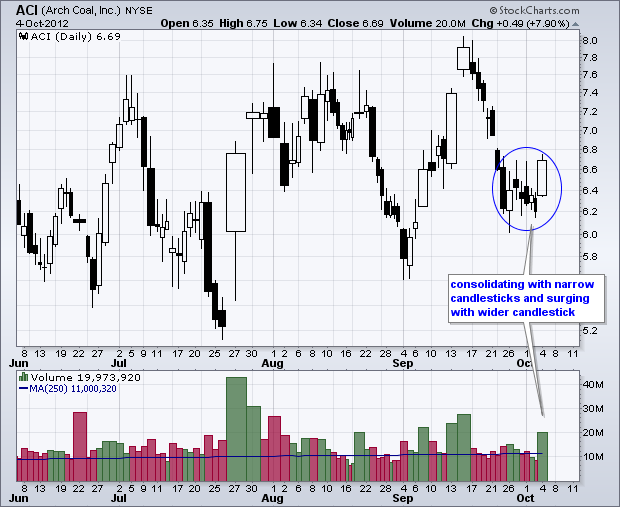
CandleVolume charts allow chartists to see candlestick patterns and relative volume levels using one plot because the width of the candlestick is based on volume. Narrow candlesticks indicate low volume. Wide candlesticks indicate high volume. Chartists can combine candlesticks and volume to validate candlestick patterns. The example below shows Starbucks (SBUX forming a bearish engulfing in mid September. Notice that the candlestick is wide because volume surged. The second example shows Arch Coal (ACI) consolidating with narrow candlesticks on low volume and then surging with a wide candlestick as volume expanded.


Click this image for a live chart.


Click this image for a live chart.


