|
|
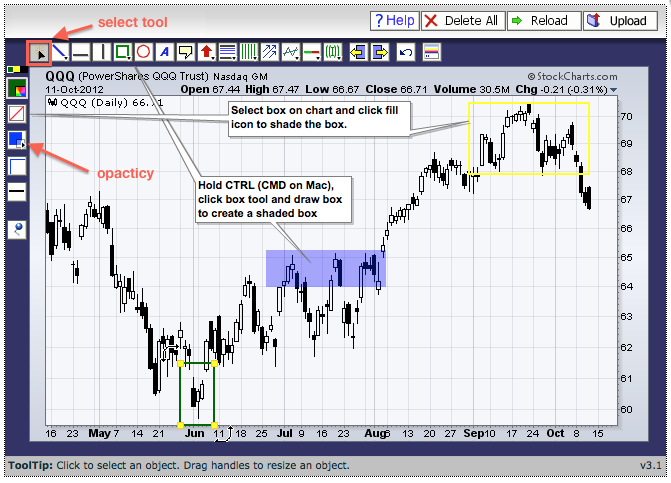
There are two ways to draw a filled shape when annotating a SharpChart. The first method uses the CTRL key. Chartists simply hold down the CTRL key, click the desired shape and draw it on the price chart. This method was used to draw the shaded rectangle in July. Mac users should click the CMD key instead of the CTRL key.

The second method is to edit an existing outline shape. After drawing a shape, click the select tool in the upper left and then click on the outline of the shape. Options will then appear on the left side of the annotation window. Users can click the second square icon from the top to change the shading preference. The icon below this one can be use to change the opacity. You can read more on the drawing functions in our knowledge base.

The second method is to edit an existing outline shape. After drawing a shape, click the select tool in the upper left and then click on the outline of the shape. Options will then appear on the left side of the annotation window. Users can click the second square icon from the top to change the shading preference. The icon below this one can be use to change the opacity. You can read more on the drawing functions in our knowledge base.


