|
|
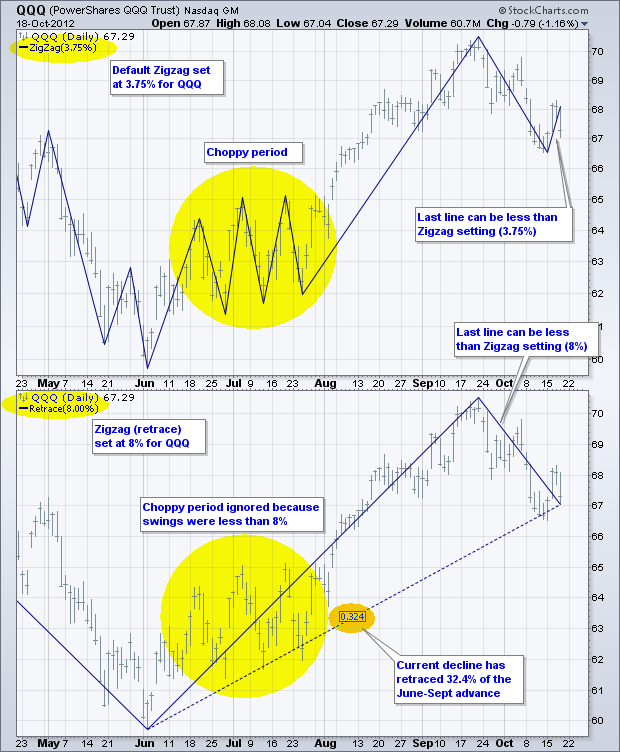
The Zigzag (retrace) indicator can be used to measure the length of a retracement and filter out insignificant moves. First, note that the Zigzag indicator simply highlights price moves that meet a minimum requirement for percentage change. When selecting the Zigzag indicator in SharpCharts, the parameters box will be blank. This is because StockCharts.com uses an algorithm to compute the Zigzag based on the volatility of the underlying security. The Zigzag setting can be seen in the upper left of the chart window. As the example below shows, the default Zigzag for QQQ is 3.75%. For reference, the default Zigzag for SPY is 2.11%.

CLick this image for a live chart (sans indicators)
The lower chart shows the Zigzag (retrace) indicator set at 8%. With this setting, I chose to filter out price moves that were less than 8%. Notice how the 8% Zigzag filters the volatility seen in late June and July. The Zigzag (retrace) also shows the retracement amount. In this case, the five week decline has retraced 32.4% of the June-Sept advance. One final note: the last line in the Zigzag simply extends from the prior high or low to the current price. It is often less than the Zigzag setting and subject to change as prices evolve. You can read more on the Zigzag in our ChartSchool article.


