|
|
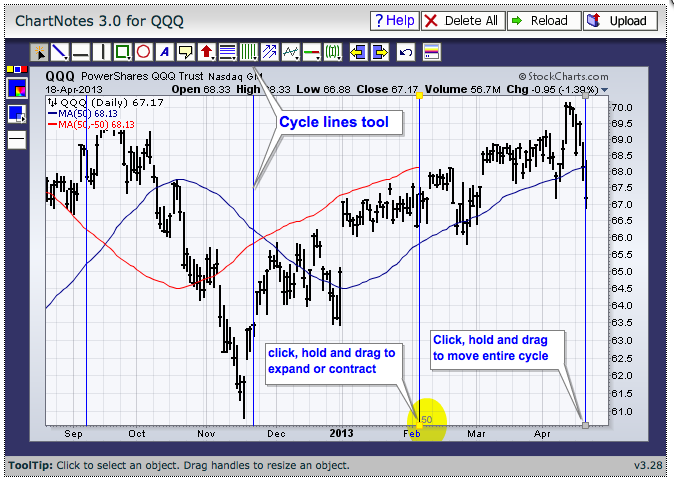
Chartists sometimes need to count back a specific number of days on a chart. This can be to set a cycle high/low or simply to count the number of trading days since a high/low. Chartists can easily count by using the cycle lines tool on SharpCharts. When annotating a chart, this tool can be found in the middle of the top tool bar. Click the icon to activate, move to the chart and click-drag to place the cycle lines on the chart.

The chart above shows the Nasdaq 100 ETF (QQQ) with the cycle lines starting on Thursday. Chartists can click-drag the gray box at the top or bottom to move the entire cycle. Chartists can click-drag the yellow box at the top or bottom of the second line to expand or contract the cycle. As the number shows, this cycle is set at 50 days and the second line extends to February 5th. See our ChartSchool article for more on cycle lines.

The chart above shows the Nasdaq 100 ETF (QQQ) with the cycle lines starting on Thursday. Chartists can click-drag the gray box at the top or bottom to move the entire cycle. Chartists can click-drag the yellow box at the top or bottom of the second line to expand or contract the cycle. As the number shows, this cycle is set at 50 days and the second line extends to February 5th. See our ChartSchool article for more on cycle lines.


