|
|
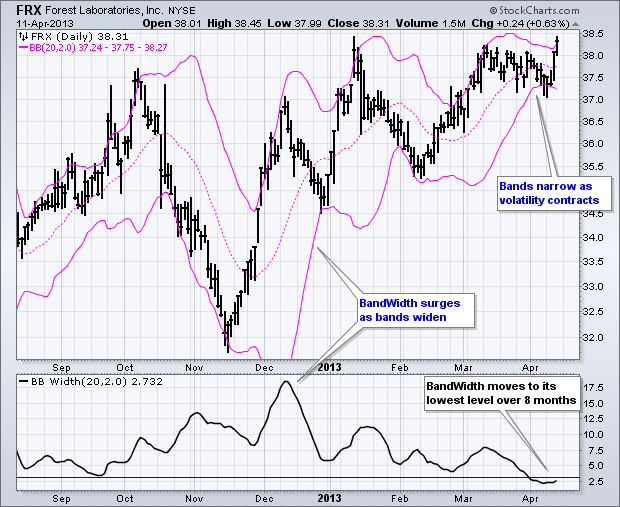
Chartists can quantify the difference between the two Bollinger Bands by using the BandWidth indicator. Bollinger Bands start with a 20-day simple moving average of closing prices. The actual bands are then placed two standard deviations above and below this moving average. These equidistant bands expand as volatility increases and contract as volatility decreases. John Bollinger theorized that volatility contractions lead to volatility expansions, or price moves.

Chartists can eyeball the price chart to identify volatility contractions and use the BandWidth indicator to compare bandwidth over time. BandWidth is simply the upper band less the lower band divided by the middle band. This shows the difference as a percentage of the middle band, which allows user to evaluate bandwidth over time. Chartists can plot the Bandwidth indicator and easily spot periods of low volatility. You can read more about the BandWidth indicator in our ChartSchool.

Chartists can eyeball the price chart to identify volatility contractions and use the BandWidth indicator to compare bandwidth over time. BandWidth is simply the upper band less the lower band divided by the middle band. This shows the difference as a percentage of the middle band, which allows user to evaluate bandwidth over time. Chartists can plot the Bandwidth indicator and easily spot periods of low volatility. You can read more about the BandWidth indicator in our ChartSchool.


