|
|
StockCharts.com has three indicators that separate positive (up) and negative (down) price movement: the Directional Movement Indicators, Aroon and the Vortex Indicators. These indicators are shown as pairs with the green line measuring positive price movement and the red line measuring negative price movement. These indicator pairs trigger signals when the lines cross. Some crosses are short and only last a few days. Some crosses last for weeks or even months.
Chartists can reduce whipsaws by requiring the indicator to reach a specific threshold to validate a signal. This means the signal would require two steps. Using the Aroon brothers as an example, a bullish signal is triggered when Aroon Up crosses above Aroon Down AND Aroon Up hits 100. The threshold could be 30 for the Directional Movement Indicators (+DI and –DI), and 1.1 for the Vortex Indicators (+VI and –VI).

Click this image for a live chart
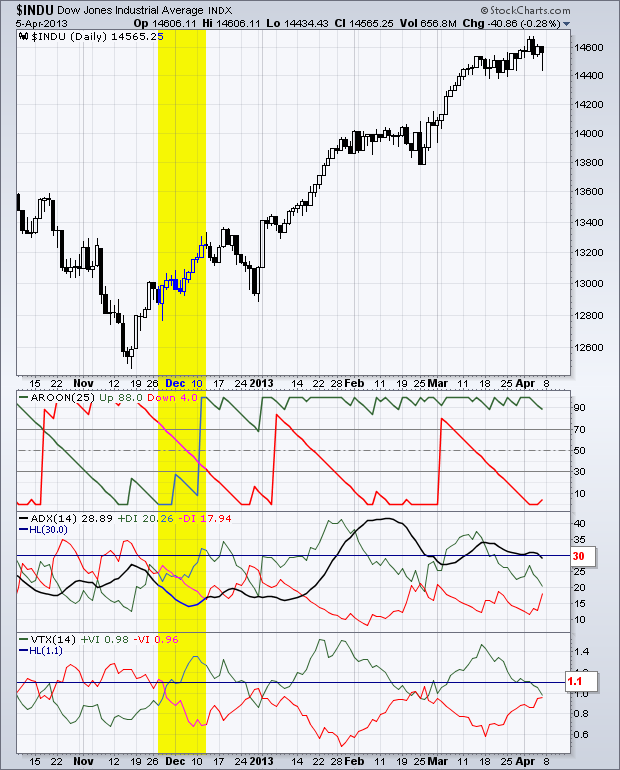
The chart for the Dow Industrials shows all three indicator pairs triggering bullish signals in late November and early December. Moreover, these indicators remain in bull mode. Aroon Up crossed above Aroon Down and reached 100. Aroon Down needs to cross above Aroon Up and reach 100 to reverse this signal. +DI crossed above –DI and exceeded 30 to confirm. –DI needs to cross above +DI and above 30 to negate this signal. +VI crossed above –VI and exceeded 1.1 to confirm. –VI needs to cross +VI and exceed 1.1 to reverse this signal. See our ChartSchool for more information on these indicators.
Chartists can reduce whipsaws by requiring the indicator to reach a specific threshold to validate a signal. This means the signal would require two steps. Using the Aroon brothers as an example, a bullish signal is triggered when Aroon Up crosses above Aroon Down AND Aroon Up hits 100. The threshold could be 30 for the Directional Movement Indicators (+DI and –DI), and 1.1 for the Vortex Indicators (+VI and –VI).

Click this image for a live chart
The chart for the Dow Industrials shows all three indicator pairs triggering bullish signals in late November and early December. Moreover, these indicators remain in bull mode. Aroon Up crossed above Aroon Down and reached 100. Aroon Down needs to cross above Aroon Up and reach 100 to reverse this signal. +DI crossed above –DI and exceeded 30 to confirm. –DI needs to cross above +DI and above 30 to negate this signal. +VI crossed above –VI and exceeded 1.1 to confirm. –VI needs to cross +VI and exceed 1.1 to reverse this signal. See our ChartSchool for more information on these indicators.


