|
|
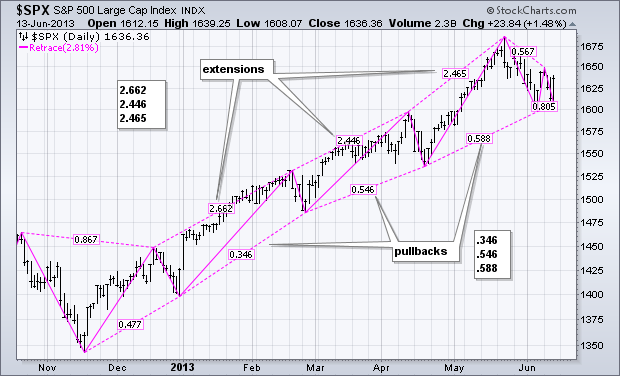
Chartists can use the Zigzag (retrace) indicator to show retracement amounts directly on the price chart. There are two types of Zigzag in the overlays section: Zigzag and Zigzag (retrace). Zigzag is not an indicator per se. Instead, it filters price changes by requiring a minimum movement before changing direction. A Zigzag set at 5 would only show price moves that were 5% or more. Zigzag (retrace) adds another dimension by showing the retracement amounts as dotted lines.

Click this image for a live chart
The chart above shows the S&P 500 with the default value for the Zigzag (retrace), which is 2.81%. Chartists can change this value by entering another number in the parameters box. The default setting is based on the volatility of the underlying and will change accordingly. On the price chart, I highlighted three extensions and three pullbacks. The extensions are around 2 and a half times the prior pullback. The last three pullbacks ranged from .346 to .588 (34.6% to 58.8%). I am not counting the last pullback (.805) because it represents the decline this week’s decline (Tuesday-Wednesday). You can read more about Zigzag in our ChartSchool.


