|
|
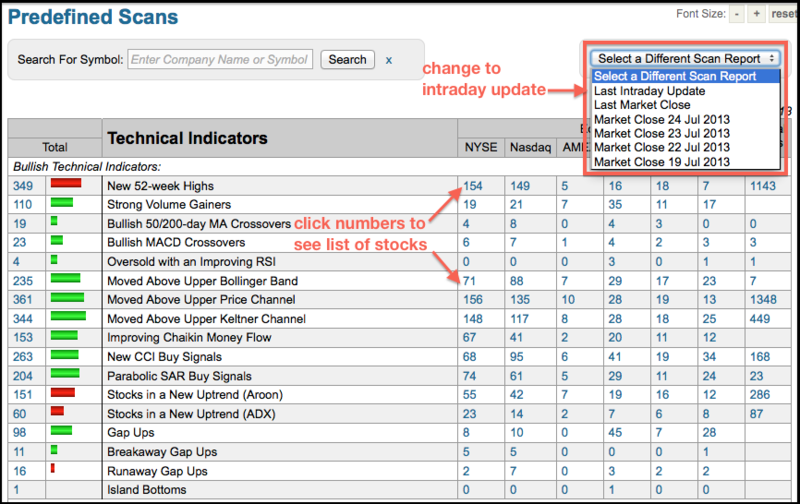
StockCharts updates its predefined scans page throughout the trading day. Chartists can use the dropdown menu in the upper right to change the setting to “last intraday update”. The pre-defined scans page contains dozens of scans organized in bullish and bearish groups. Chartists can find bullish indicator signals, bearish indicator signals, bullish candlestick formations, bearish candlestick formations, bullish P&F signals and bearish P&F signals. Notice how the left column shows the total number of signals. The change is reflected in the horizontal red and green bars. Chartists can click on the numbers to see the stocks that made a particular scan. Click the number under the NYSE column to see only NYSE stocks or click the number under the TSE column to focus on Canadian stocks.

Click this image to see a live scan page.

Click this image to see a live scan page.


