|
|
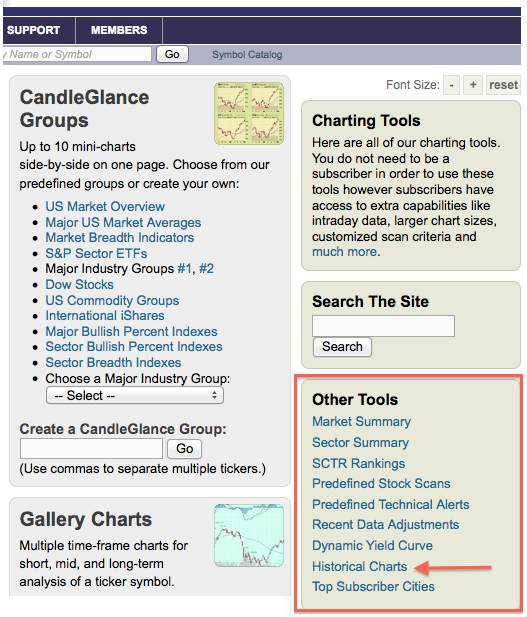
StockCharts provides long-term historical charts for the Dow Industrials, S&P 500, Nasdaq, 30-year Treasury Bond and Gold. These charts can be found by clicking the
“historical charts” link on the right navigation of the HOME page of FREE CHARTS page. This link is in the “other tools” section.

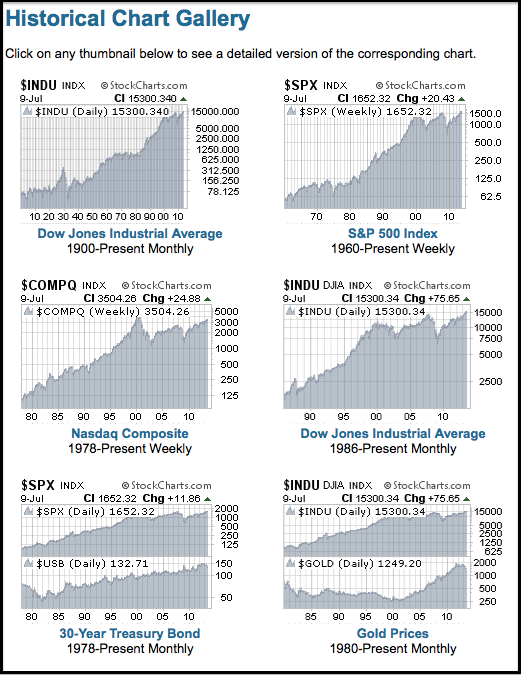
Once on the page, chartists can click the thumbnails to see these long-term charts. StockCharts has the Dow Industrials going back to 1900, the S&P 500 back to 1960 and gold back to 1980. These are monthly charts that provide a truly historical perspective for serious market students.

Click this image to see the historical charts page.

Once on the page, chartists can click the thumbnails to see these long-term charts. StockCharts has the Dow Industrials going back to 1900, the S&P 500 back to 1960 and gold back to 1980. These are monthly charts that provide a truly historical perspective for serious market students.

Click this image to see the historical charts page.


