|
|
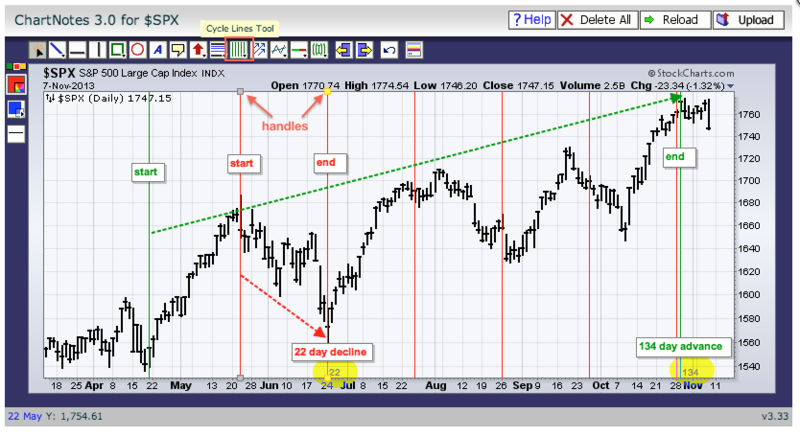
Chartists can count the number of price bars on a chart using the cycle lines tool. Knowing the number of bars or days can help chartists set indicator parameters and average out correction timeframes. As with all annotation tools, the cycle lines tool can be found using ChartNotes, which is the workbench you see when annotating a chart. The first step is to choose the price move. In the example below I chose the decline from 22-May to 24-June (red lines) and the advance from 19-April to 29-October (green lines). Next choose the cycle lines tool at the top (icon with vertical lines). Move the mouse pointer to the starting point, left click/hold and drag the lines to the ending point. The distance between the first line and second line is shown at the bottom of the chart. The May-June decline was 22 trading days and the April-October advance was 134 trading days. The small squares at the top of the first two lines are handles. Click and drag the gray square to move the entire cycle forwards or backwards. Click and drag the yellow square to change the cycle length. You can read more about the cycles in our ChartSchool article.
Click this image for a live chart


Posted by: Marc Slavin November 08, 2013 at 10:49 AM