|
|
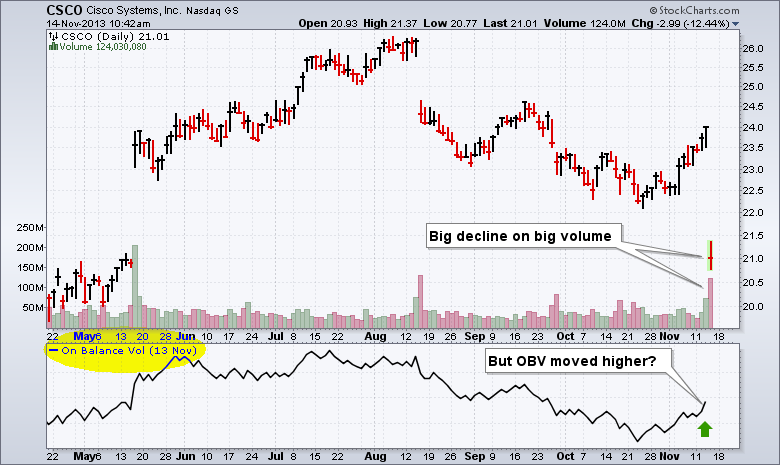
Volume-based indicators are updated when each time period is complete. For daily charts, this means volume-based indicators are updated after the market close. Similarly, volume-based indicators on 30-minute charts are updated at the end of each 30 minute period. Price and volume data are both subject to change prior to a period's end. Waiting for definitive data ensures that the volume-based indicators are based on correct, and unchanging, data.
Click this image for a live chart
The example above shows Cisco (CSCO) gapping down on big volume. On Balance Volume (OBV) should be moving lower, but the chart shows an advance over the last few days. This is because the indicator has yet to be updated. The date is shown next to the indicator name on the left side of the indicator window. The gap down occurred on 14-November and On Balance Vol is dated 13-November. Chartists wishing to see the affects of a big volume bar can use intraday charts. The example below shows OBV moving sharply lower on the 30 minute chart. Notice the small space between OBV and the current price bar. This is because OBV will be updated when this bar is complete. All of our volume-based indicators are covered in detail in our ChartSchool.
Click this image for a live chart


