|
|
On Balance Volume (OBV) and the Accumulation Distribution Line are both volume-based indicators that combine price action and volume. On Balance Volume (OBV) compares the close to the prior close, while the Accum/Dist Line compares the close relative to the high-low range. OBV is quite simple because it adds volume on up days and subtracts volume on down days. This is the same as multiplying volume by +1 on up days and -1 on down days.
The Accumulation Distribution Line creates a volume multiplier that ranges from +1 and -1. This multiplier is positive when the close is above the mid point of the high-low range and negative when below the mid point. The multiplier is +1 when the close is on the high and -1 when the close is on the low.
Click this image for a live chart
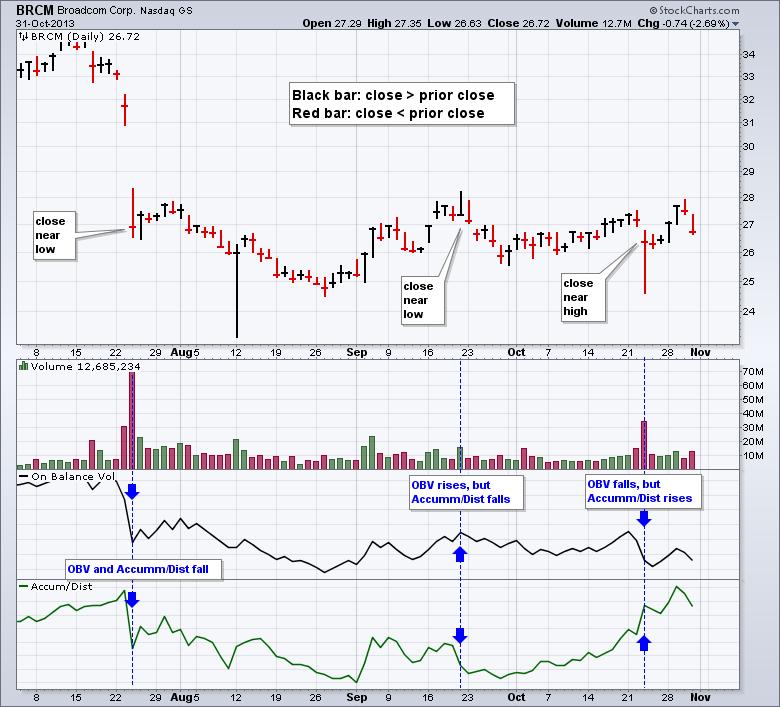
The chart above shows BroadCom with OBV and the Accum/Dist Line. Three days are highlighted to show the difference in these two indicators. First, the stock gapped down, closed lower and closed near the low of the day in late July. Volume was high so OBV and the Accum/Dist Line fell sharply. The second example shows Broadcom closing higher in late September, but closing at the low of the day. OBV rose because volume was added, but the Accum/Dist Line fell because the multiplier was -1. The third example shows the stock gapping lower, closing lower and closing at the high end of its range. OBV fell because the close was down, but the Accum/Dist Line rose because the multiplier was positive.
So which one is better? Truth be told, they both have their pluses and minuses. It is really a matter of preference. Chartists can consider using both for confirmation. Upside breakouts in both would show buying pressure, while downtrends in both would show consistent selling pressure. You read more about these indicators in our ChartSchool.


Posted by: Richard A Knutson November 01, 2013 at 12:26 PM
Posted by: Chris Pritchard November 03, 2013 at 01:43 AM