|
|
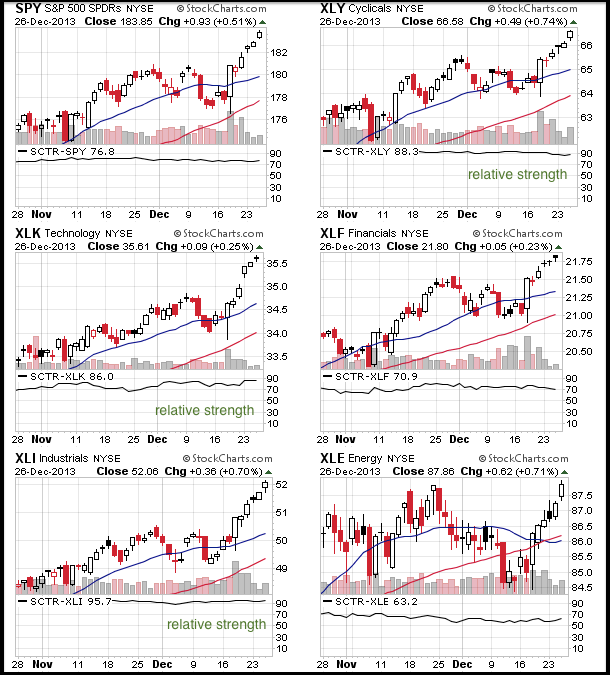
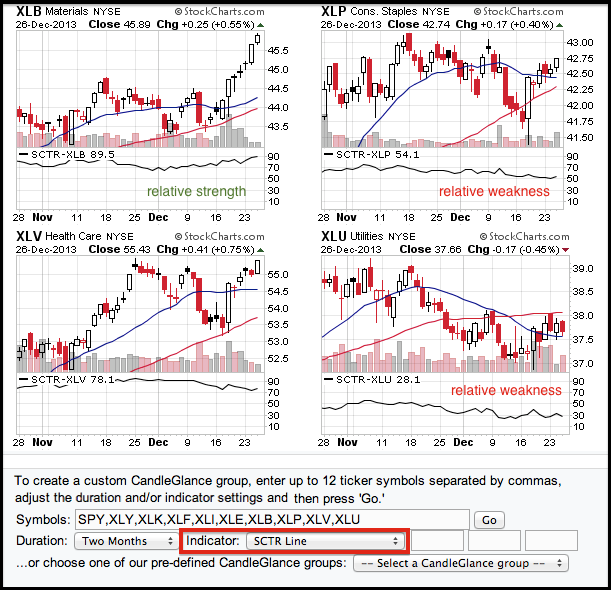
Chartists can compare the StockCharts Technical Rank (SCTR) for the nine sector SPDRs by setting up CandleGlance charts with the SCTR as an indicator. This can be done with three easy steps. First, go to the CandleGlance symbol entry box on the FreeCharts page. This can be found near the top of the third section/column. Second, enter the symbols for the nine sector SPDRs and click go. I threw in the S&P 500 ETF (SPY) for good measure (SPY,XLY,XLK,XLF,XLI,XLE,XLB,XLP,XLV,XLU). Third, scroll down to the bottom of the CandleGlance page and add SCTR as an indicator. Click go and you will see ten CandleGlance charts with the SCTR. Chartists can then find the sectors with the highest and lowest SCTR. This makes it easy to focus on sector showing relative strength and avoid sectors showing relative weakness. It also makes it easy to identify upturns and downturns in the SCTR.
Click this image for a live CandleGlance Page


