|
|
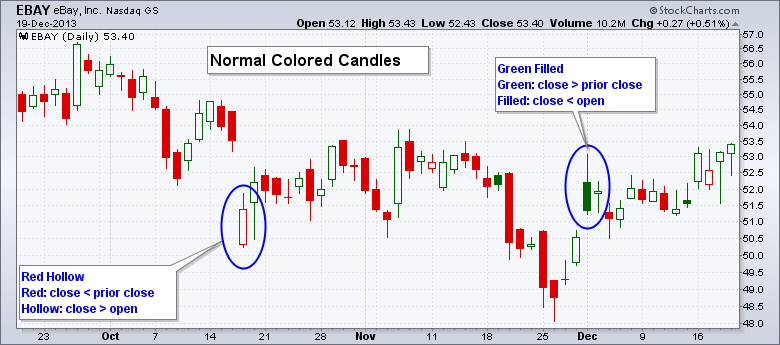
Solid candlesticks are a new feature available on SharpCharts. In short, checking the “solid candles” box will fill and color all candlesticks based on the relationship between the open and the close. First, let’s look at some normal colored candlesticks and review the rules. A candlestick is green when the current close is above the prior close, and red when the close is below the prior close. A candlestick is hollow when the current close is above the current open, and filled (solid) when the close is below the prior open.

The first chart shows EBAY with normal colored candlesticks and two warrant our attention. First, the hollow red candlestick on 17-Oct indicates that the close was below the prior close, but the close was higher than the open. EBAY opened near the low, but rose and closed well above its open. Second, the filled green candlestick on 2-Dec indicates that the close was above the prior close, but the close was below the open. This means EBAY came under selling pressure after a strong open and close below the opening price.

The second chart shows EBAY with the same colored candlesticks, but with the “solid candles” box checked. Note that I chose green for up candlesticks and red for down candlesticks. A solid candlestick is green when the close is above the open and red when the close is below the open. That’s it. The relationship between the close and the prior close does not matter. We now see a filled green candlestick on 17-Oct because the close was above the open and a filled red candlestick on 2-Dec because the close was below the open. Note: chartists need to choose two different colors when selecting the “solid candles” option. Otherwise, all candlesticks will be filled with the same color.


