|
|
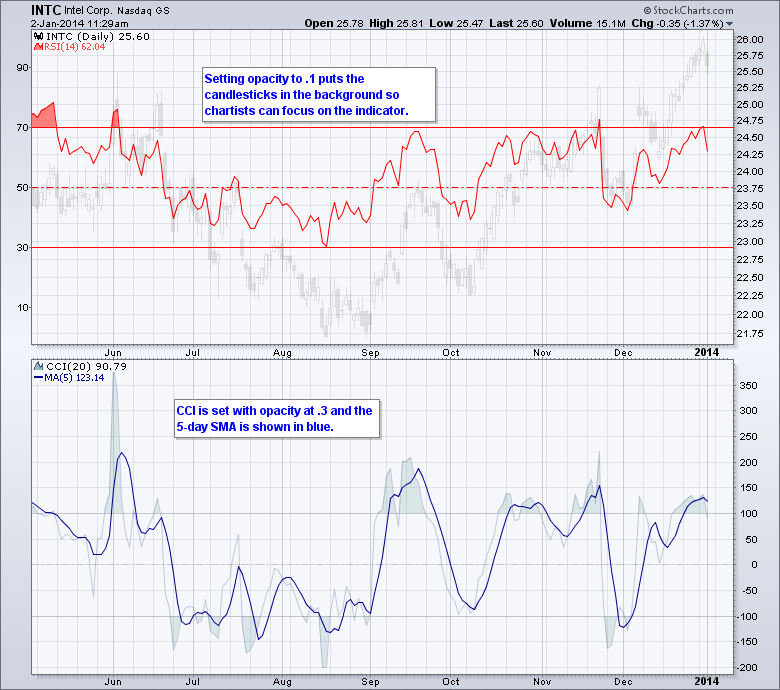
Chartists can adjust the transparency of a price plot using the opacity feature on SharpCharts. First, create a chart with bars or candlesticks. Second, go to “Opacity” in the “Chart Attributes” section. Setting opacity at 0 will make the price plot invisible. The price plot becomes more visible as the opacity is increased. The example below shows candlesticks for Intel with the opacity set at .1, which makes them very transparent. RSI has been placed as an indicator behind the price. Transparent candlesticks make it easier to focus on indicator signals.
Chartists can also hide an indicator or make it transparent using the opacity feature. First, add an indicator to the SharpChart. Second, open the advanced features and go to “opacity”. The example above shows the Commodity Channel Index (CCI) with opacity set at .3 to put the indicator in the background. A 5-day SMA was also added to smooth out this volatile indicator.


