|
|
StockCharts subscribers have access to intraday data for the advance-decline indicators covering the AMEX, Nasdaq and NYSE. Note that intraday data is not available for free users. These indicators include advances, declines, net advances, advancing volume, declining volume and net advancing volume. Net advances equals advances less declines, while net advancing volume equals advancing volume less declining volume.
Click this image for a live table.
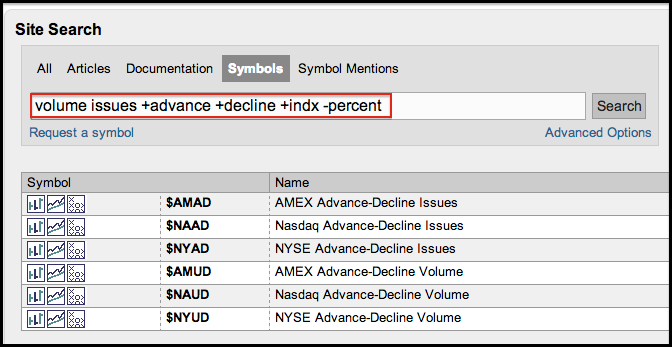
Chartists will most likely focus on net advances and net advancing volume because these can be used to create intraday AD Lines and AD Volume Lines. The table below shows the symbols and symbol-search terms. Notice how users can narrow their search using the plus and minus signs. Terms with a plus sign must be included, while terms with a minus sign must be excluded.
Click this image for a live chart
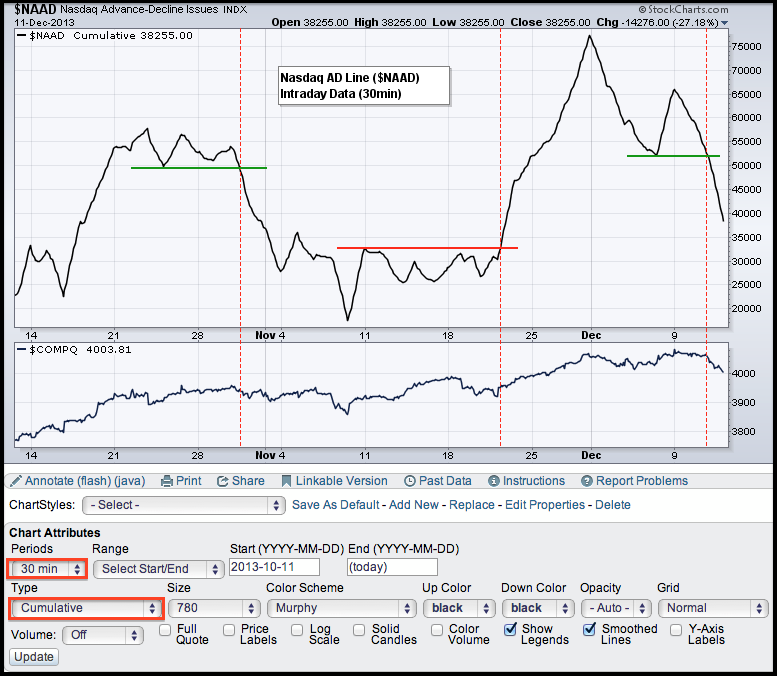
The chart above shows an example of the Nasdaq AD Line using $NAAD, which is the symbol for net advances on the Nasdaq. Chartists can access intraday data by changing the period setting. The AD Line can be created by choosing “cumulative” as the chart “type”. Intraday AD Lines and AD Volume Lines can be quite valuable to swing traders. Notice how the Nasdaq AD Line reversed its trend three times in the last two months. Chartists can even apply indicators to the AD Line for further analysis. You can read more about the AD Line in our ChartSchool.


