|
|
Joe Granville was a Technical Analyst legend. He passed away on September 7, 2013. I am sure most technicans checked the dates to see if they were not Fibonacci numbers or checked them against other Technical Analysis systems. While Joe was not an Elliott Wave man, he was a pioneer in Technical Analysis. His words could spike the market. One of his calls was for his newsletter readers to "Sell Everything" and he dropped the $SPX 2.4% that day.( Source-Bloomberg). You can read more from a nice obituary published on Bloomberg. Joe Granville . I'll let you read that article to see why the OBV quite literally caught Joe with his pants down.
Arthur Hill published a huge amount of work in our ChartSchool, and in there he explained the OBV or On Balance Volume indicator. The link to the OBV article can be found here.
Joe focused on price action and volume. Here is the description of OBV.
On Balance Volume (OBV) measures buying and selling pressure as a cumulative indicator that adds volume on up days and subtracts volume on down days. OBV was developed by Joe Granville and introduced in his 1963 book, Granville's New Key to Stock Market Profits. It was one of the first indicators to measure positive and negative volume flow. Chartists can look for divergences between OBV and price to predict price movements or use OBV to confirm price trends.
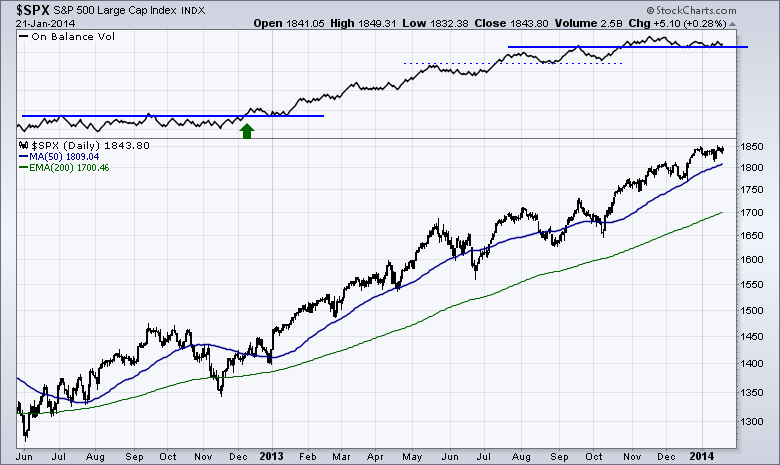
So why all this talk about OBV? Let's look at the OBV on the $SPX. The important thng to notice is how the OBV behaves. We can see the breakout in December 2012 based on the Fed QE program. I think the date of the announcement was Dec 12, 2012. From a sideways pattern for 6 months, the OBV jumped to say this was the real deal in December 2013. After that, the OBV continued to stairstep higher. When I looked through the year, the previous high became support for the next pullback. See the dotted line on the indicator for the example of this. You could have used this as a guide all the way up.
So why the discussion today?
Well, the OBV has moved sideways for 3 months and before that it had moved sideways for three months. It seems to be losing its upside momentum while the market continues higher. I would note that with the last push up off the December lows, the OBV went down. Is that enough divergence? We also have lower highs on the OBV and higher highs in price. I think we might have to be ready if it breaks down, but the OBV is still holding a higher lows trend.
In the ChartSchool article, there is a discussion of divergence. This is the paragraph.
Bullish and bearish divergence signals can be used to anticipate a trend reversal. These signals are truly based on the theory that volume precedes prices. A bullish divergence forms when OBV moves higher or forms a higher low even as prices move lower or forge a lower low. A bearish divergence forms when OBV moves lower or forms a lower low even as prices move higher or forge a higher high. The divergence between OBV and price should alert chartists that a price reversal could be in the making.
What did it behave like in 2007? Below is a chart of the 2007 top. The OBV is a very subtle indicator.
You can see it made a lower low in October and failed to rally in late October/November rally.
So lets keep watching the OBV. It has been persistently indicating to stay a bull in this market. Today it rests on support. A move either way over the next month should be important. I do not interpret an OBV move down as an expectation of a major market top. It just indicates that the market may need a rest. We have not tested the 200 DMA in over a year. I would expect a bounce off of the 100 DMA or 200 DMA before any major top was put in. An example might be the left hand side of the chart in late February 2007. The OBV made a little lower low. The market had a pullback to the 200 DMA and then accelerated from there.
Don't forget to book into Atlanta SCU101 and SCU 102. Hedge fund managers, portfolio managers and retail traders will all find value.
Good trading,
Greg Schnell, CMT.


