|
|
Moving Average Envelopes and Keltner Channels both start with a moving average to calculate their outer lines. The outer lines for Keltner Channels are based on the Average True Range (ATR), which is a volatility indicator. Moving Average Envelopes, on the other hand, are simply placed a set percentage above and below the moving average. Also note that Keltner Channels use an exponential moving average for the middle line. Chartists can choose between an exponential moving average or a simple moving average for Moving Average Envelopes.
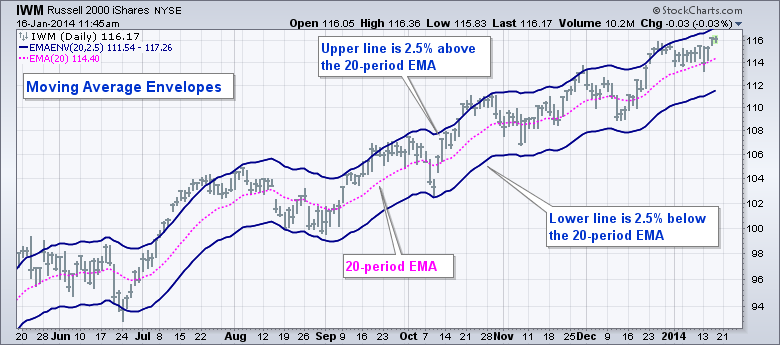
Let's look at the differences using a chart for the Russell 2000 ETF (IWM). The first example shows Moving Average Envelopes based on an exponential moving average (exp). The outer lines are 2.5% above and below the 20-period EMA. Note that the 20-period EMA is usually not shown with Moving Average Envelopes so I added it as a separate indicator, which is why it is shown in pink.
The second example shows Keltner Channels with the default parameters (20,2.0,10). By default, the middle line is a 20-period EMA. The channel lines are based on the 10-period Average True Range (ATR). The upper line is the 20-period EMA plus two 10-period ATR values. The lower line is the 20-period EMA less two 10-period ATR values. 10-period ATR is shown in the indicator window so chartists can see how if affects the channel lines. In general, Keltner Channels are more dynamic than Moving Average Envelopes because they are based on a volatility indicator. You can read more about these indicators in our ChartSchool.


