|
|
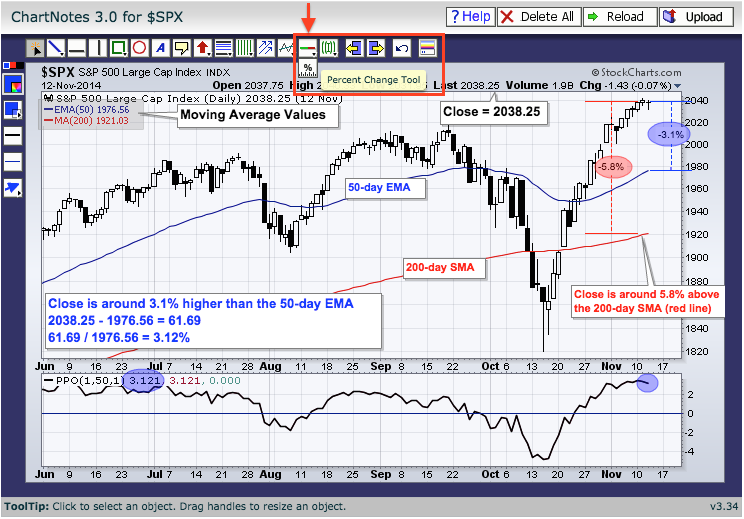
There are two ways to measure the distance between a price point and a moving average. First, chartists can simply use the "percentage change" tool when annotating a chart. This tool can be found right under the "auto support-resistance" tool. Note that you can hover over any icon with a small triangle in the right corner to reveal other icons. Select the percentage change tool, move to the moving average, click and drag the tool to the price point. The example below shows the percentage change tool extending from the 200-day simple moving average and the 50-day exponential moving average.
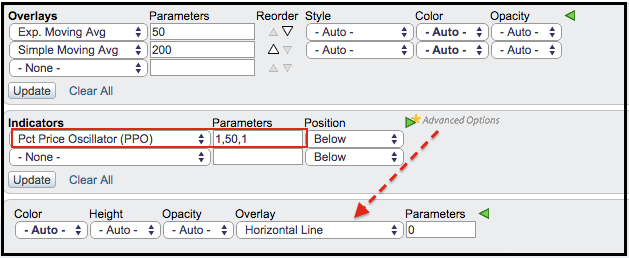
Chartists can also use the Percentage Price Oscillator (PPO) to measure the distance from the close or last price and an exponential moving average. Simply set the PPO to (1,50,1). The first "1" represents a 1-period EMA, which is just the close or last price. The "50" represents the 50-day EMA. The other "1" is for the signal line. Setting the signal line at 1 simply hides it. The PPO measures the percentage difference between two exponential moving averages. In this case, we are measuring the distance between the 1-day EMA and the 50-day EMA, which is around 3.1%.


