|
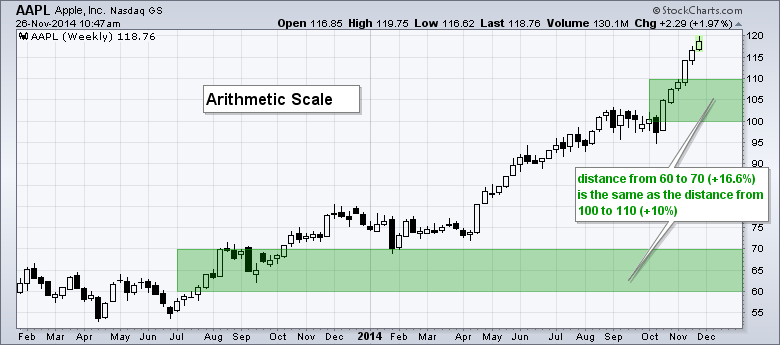
The difference between a logarithmic and arithmetic chart scale can be seen on the vertical axis, which is the y axis. An arithmetic scale shows equal spacing between the chart units. In the example below, horizontal lines are spaced every 5 Dollars and they are equally spaced from top to bottom. A ten Dollar change from 60 to 70 looks the same as a ten Dollar change from 100 to 110.
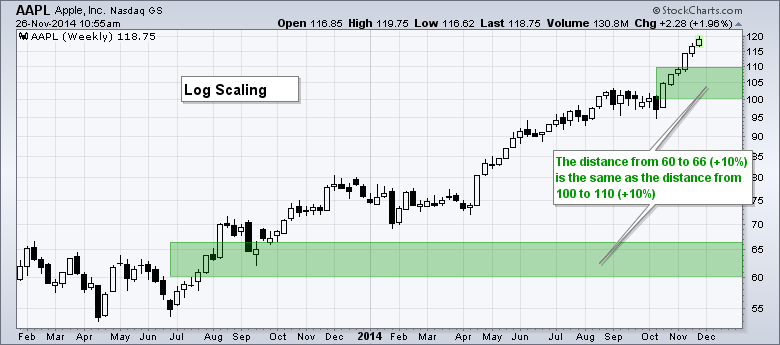
A semi-logarithmic scale, on the other hand, is set up to measure price distances in percentage terms. This means a 10% advance from 60 to 66 looks the same as a 10% advance from 100 to 110, even though the first advance is six Dollars and the second advance is ten Dollars.
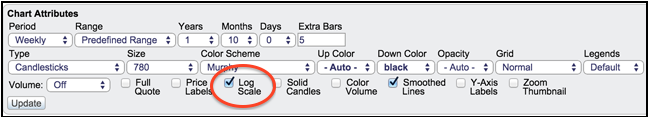
So which scaling system is best? Both systems have their advantages and disadvantages. One's preference largely depends on analysis style and timeframe. Traders looking to capture short-term price movements or analyze trading ranges may prefer arithmetic scales for price purity. Chartists interested in trends and long-term price histories will likely prefer log scaling. Notice that a log scale is best used when prices have moved a significant amount, up or down. Chartists can switch between arithmetic and log scaling by using the "log scale" check box in the Chart Attributes sector under the SharpChart.