|
|
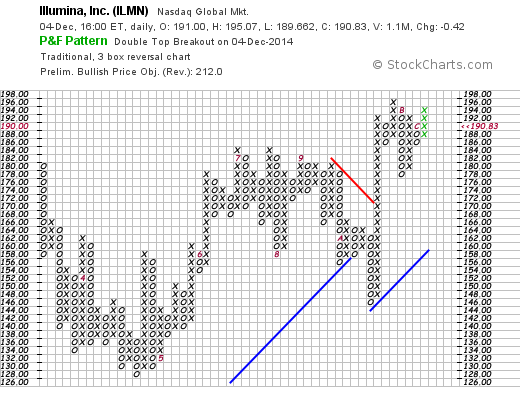
A Bullish Percent Index measures the percentage of stocks within a particular group that are on Point & Figure buy signals. A stock is either on a P&F sell signal or a P&F buy signal, there is no gray area here. A P&F sell signal is a Double Bottom Breakdown, which occurs when the current O-Column moves below the low of the prior O-Column. A P&F buy signal is a Double Top Breakout, which occurs when the current X-Column moves above the high of the prior X-Column. The first chart shows Illumina (ILMN) with a Double Top Breakout and the second chart shows Mattel (MAT) with a Double Bottom Breakdown.


The next chart shows the Bullish Percent Index for the Nasdaq 100 ($BPNDX) at 74%, which means 74 of the 100 stocks are on P&F buy signals. This also implies that 26% are on P&F sell signals. In its most basic form, the Bullish Percent Index favors the bulls when above 50% and the bears when below 50%. Chartists can also look for divergences and overbought/oversold readings for signals.
StockCharts calculates and publishes the Bullish Percent Index for over a dozen indices and sectors. The image below shows the available symbols. Users can search "bullish and percent and index" in the symbol catalog to find these symbols (without quotation marks). Preceding a term with the word "and" means this term is required in the results.


