|
|
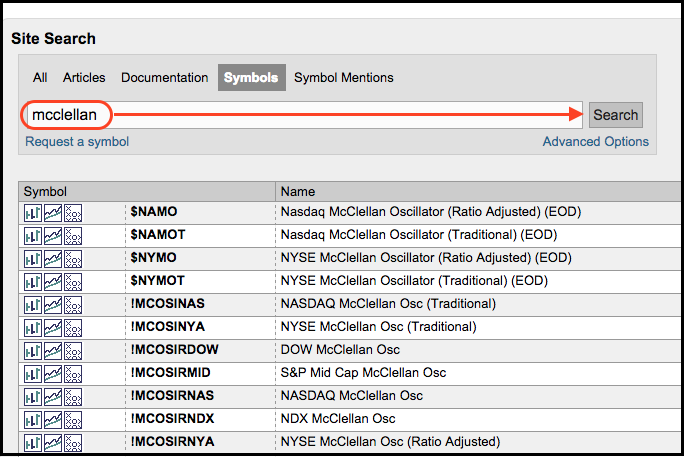
There is a little indicator "hack" that chartists can use to update the McClellan Oscillator during the day. First, note that StockCharts has end-of-day (EOD) symbols for the McClellan Oscillators. Simply search for the term "mcclellan" in the symbol catalog. The symbols beginning with an exclamation point (!) come from the DecisionPoint merger and these indicators are also updated after the close. The ratio-adjusted McClellan Oscillator uses the ratio of net advances [(advances less declines) divided by total issues]. The traditional McClellan Oscillator simply uses net advances (advances less declines).
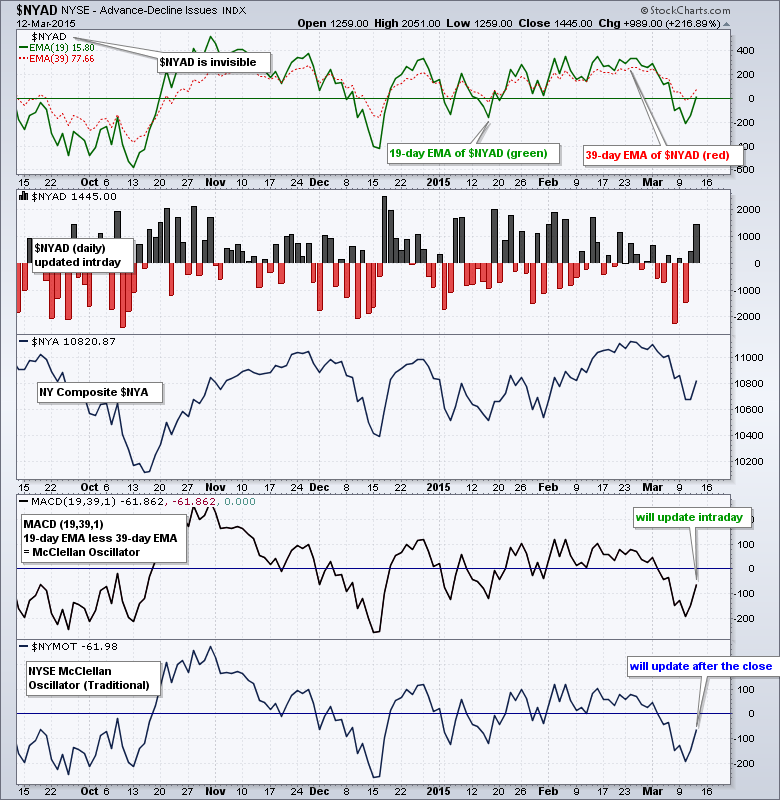
This hack works for the Nasdaq and NYSE McClellan Oscillator because StockCharts has intraday data for Nasdaq Net Advances ($NAAD) and NYSE Net Advances ($NYAD). First, create a chart for NYSE Net Advances ($NYAD), which is the base indicator for the NYSE McClellan Oscillator. Note that I made this base indicator invisible in the main chart window and added the 19-day EMA and 39-day EMA because the McClellan Oscillator is the difference between these two EMAs. For reference, I also added $NYAD as an indicator in histogram format below the main window and the NY Composite Index for reference.

Click this image for a live chart
Chartists can now create the McClellan Oscillator by adding MACD(19,39,1) as an indicator. This will plot the difference between the 19-day EMA of $NYAD and the 39-day EMA of $NYAD. For reference, I also added the NY McClellan Oscillator ($NYMOT) in the lower indicator window. The values are not exact, but they are very close and the line shapes are exactly the same. More importantly, the MACD version is updated during the day and the crosses above/below the zero line are the same for both indicators.


