|
|
The Sector Summary page is designed to help chartists find the best performing sectors, industry groups and stocks. Using a top-down approach, users start with the sectors to see a break down of the broader market. Click on a sector to see the industry groups in that sector and click on the industry group to see the stocks in that group. Chartists can also adjust the timeframe, sort the various columns, apply PerfCharts, use MarketCarpets and use some symbol groups in a Relative Rotation Graph (RRG).
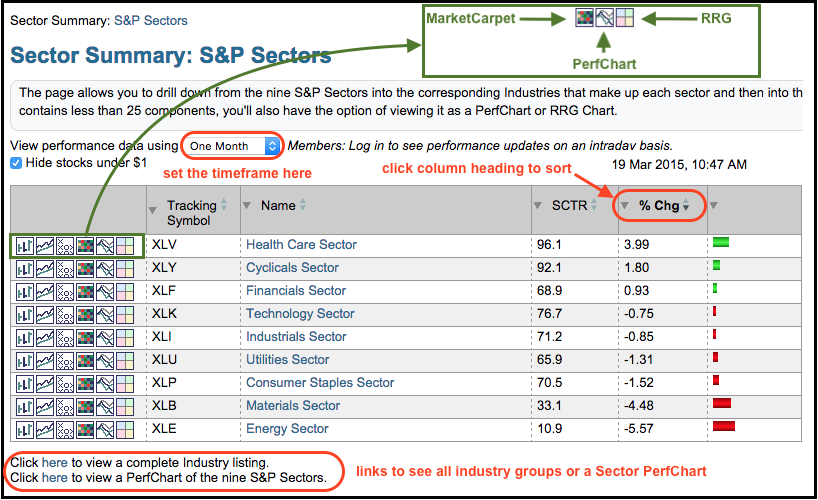
The example below shows the landing page for the Sector Summary. The timeframe is set at one month and the table is sorted by percentage change. XLV, XLY and XLF are the strongest sectors over the past month. In fact, they are the only three showing gains.
The second chart shows a RRG for the industry groups associated with the cyclicals sector (consumer discretionary). Simply click the RRG icon/link on the left side of the sector summary table for this chart. Note that there are two changes to this RRG. First, I set the tail length at zero because there are a lot of symbols on this chart. Second, I changed the benchmark to XLY because we want to compare the industry groups within the sector. The table below the RRG shows the groups in the green (leading quadrant) and blue (improving quadrant). The green quadrant shows the groups with relative strength and positive momentum right now. The blue quadrant shows the groups with potential to cross into the leading quadrant, especially those furthest to the right.
Chartists can also drill down into the sector summary by clicking on the sector and industry group names. Clicking on the "Cyclicals Sector" will generate a table with all the industry groups, such as the one below. Clicking on the industry group names will generate a table with all the stocks in that industry group. In this manner, it is quite easy to move from sector to industry group to stock and find the leaders.


